HDR Imaging Introduction dr. Francesco Banterle - PowerPoint PPT Presentation
HDR Imaging Introduction dr. Francesco Banterle francesco.banterle@isti.cnr.it Who I am 2007 2010 2004 2007 2009 Reference material High Dynamic Range Imaging, Reinhard et al. 2010, Morgan Kaufmann Advanced High Dynamic
HDR Imaging Introduction dr. Francesco Banterle francesco.banterle@isti.cnr.it
Who I am 2007 2010 2004 2007 2009
Reference material • “High Dynamic Range Imaging”, Reinhard et al. 2010, Morgan Kaufmann • “Advanced High Dynamic Range Imaging”, Banterle et al. 2011, CRC press • “High Dynamic Range Imaging”, Mantiuk et al. 2015, Wiley (free): http://pages.bangor.ac.uk/~eesa0c/pdfs/mantiuk15hdri.pdf • • “Inverse Tone Mapping” (Chapter 1 and 2) Banterle 2009 (free): • http://wrap.warwick.ac.uk/55447/
Exam • Writing an essay on a topic from a few papers • Programming project: • MATLAB extending HDR Toolbox + report • C++ extending Piccante + report
and now we start…
Photography • There are imaging sensors everywhere: • Mobile phones • Point-and-shoot • DSLR • Drones
Photography
Photography
Photography • I bought a reflex, nice, am I a photographer? MISSING MISSING Henri Cartier-Bresson Rome
Photography • I bought a reflex, nice, am I a photographer? • I have some doubts…
Photography • I bought a reflex, nice, am I a photographer? • I have some doubts…
Photography • How do I become a photographer? • Knowledge of the scene structure/geometry • Knowledge of my gear • Knowledge of light • It takes ages….
Photography • How do I become a photographer? • Knowledge of the scene structure/geometry • Knowledge of my gear • Knowledge of light • It takes ages….
Exposure time
Exposure time under-exposed
Exposure time under-exposed over-exposed
Exposure time Ca’ Foscari, Venezia
All exposures MISSING MISSING Bring upon the water Gustave Le Gray
The Film 32 more intensities MISSING levels of paper
The Film MISSING MISSING Ansel Adams The Tetons and the Snake River
Digital Photography
Lies of Digital Photography • Manufacturer racing on reaching more pixel rather than “better pixel” • 8-bit for each color channel: • red, green, and blue • Total 24-bit —> 16M colors • Are 16M colors a lot? • Not really, we are missing a key point: intensities!
Lies of Digital Photography • A digital camera can capture only 8-bit; more or less 256:1 • Three more intensities than paper • The human visual system (HVS) can: • perceive 10,000:1 at the same time • perceive 1,000,000:1 in total with adaptation
High Dynamic Range Imaging • To extend the range (high) that can be captured in a scene of current digital cameras • To match what can the HVS can perceive and beyond: • Picard and Mann 1995 • Debevec and Malik 1997
High Dynamic Range Imaging • How? • As Le Gray achieved it: • more photographs of the same scene • combine these photographs in a single one
High Dynamic Range Imaging
High Dynamic Range Imaging
High Dynamic Range Imaging
High Dynamic Range Imaging
What can we see? Illumination Range Luminance Range 2 Log scale cd/m -6 -2 0 4 8 ~
High Dynamic Range Imaging • HDR technology allows to • capture all intensities in a real-world scene • compress them in an efficient way • manipulate them • visualize them on different displaying technologies
HDR Imaging: what do we need to know? • We need to know: • what we are measuring • what color spaces are • how a display works • how a camera roughly works
a now, something completely different…
A bit of Radiometry • Radiometry is the science of “measuring light” • Light is radiant energy (Q): • measured in Joules (J) • The flow of radiant energy, Radiant Power (P): • measured in Watt (W = J/s)
Irradiance • Power incident upon unit area dA: Definition Unit E = dP W/m 2 dA
Irradiance • Power incident upon unit area dA: Definition Unit E = dP W/m 2 dA dA
Irradiance • Power incident upon unit area dA: Definition Unit E = dP W/m 2 dA dA
Radiance • Power incident on a unit surface area dA from a unit set of directions d ω Definition Unit d 2 P W/m 2 /sr L = dA cos θ d ω
Radiance • Power incident on a unit surface area dA from a unit set of directions d ω Definition Unit d 2 P W/m 2 /sr L = dA cos θ d ω dA
Radiance • Power incident on a unit surface area dA from a unit set of directions d ω Definition Unit d 2 P W/m 2 /sr L = dA cos θ d ω d ω dA
Radiance • Power incident on a unit surface area dA from a unit set of directions d ω Definition Unit d 2 P W/m 2 /sr L = dA cos θ d ω d ω dA
Radiant Exitance • Power emitted emitted per unit area Definition Unit M = dP W/m 2 dA
Radiant Exitance • Power emitted emitted per unit area Definition Unit M = dP W/m 2 dA
Radiant Exitance • Power emitted emitted per unit area Definition Unit M = dP W/m 2 dA
Radiant Intensity • Power per solid angle d ω Definition Unit I = dP W/sr d ω
Radiant Intensity • Power per solid angle d ω Definition Unit I = dP W/sr d ω
Radiant Intensity • Power per solid angle d ω Definition Unit I = dP W/sr d ω d ω
Radiant Intensity • Power per solid angle d ω Definition Unit I = dP W/sr d ω d ω
A bit of Photometry • It is basically Radiometry taking into account the human eye response at different wavelength • V( λ ) is the spectral sensitivity curve proposed by the Commission Internationale de l’Eclairage (CIE) • Basically, each quantity is weighted V( λ ): Z 830 L v = L e ( λ ) V ( λ ) d λ 380
Photometry 1 0.8 Normalized response 0.6 0.4 0.2 0 400 450 500 550 600 650 700 750 800 Wavelength (nm) CIE standard observer photopic luminous efficiency curve
A bit of Photometry • All previous radiometry terms have photometry counterparts: Radiant Power —> Luminous Power (P v ) [lm] (lumen) • Radiant Energy —> Luminous Energy (Q v ) [lm s] • Radiant Exitance —> Radiant Exitance (M v ) [lm/m2] • Irradiance —> Illuminance (E v ) [lm/m2] • Radiant Intensity —> Luminous Intensity (I v ) [lm/sr] = cd (candela) • Radiance —> Luminance (L v ) [cd/m2] = Nit •
Notes on measurements • Linear: 10 6 cd/m 2 • Order of magnitude (log10): 6 • f-stop (log2): 19.93 stops
A bit of Photometry: Contrast • Give a rough idea of relative luminance in the scene • useful • Formally, a relationship between the darkest and brightest value in the scene. Different contrasts: C W = L max − L min • Weber: L min C M = L max − L min • Michelson L max + L min C R = L max • Ratio: L min
A bit of Photometry: Statistics • Another important statistics is geometric mean, especially in the case of HDR imaging: N � 1 N = Y � L H = L ( x i ) + ✏ i =1 ✓ 1 N �◆ X � = exp log L ( x i ) + ✏ ✏ > 0 N i =1 N L avg = 1 X L ( x i ) N i =1
A bit of Photometry: Statistics 7000 6000 5000 Number of pixels 4000 3000 2000 1000 0 − 4 − 3 − 2 − 1 0 1 2 Order of magnitude
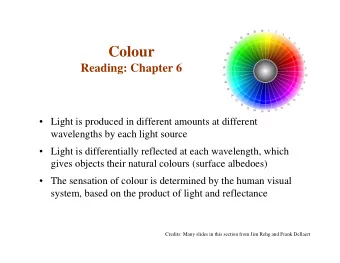
A bit of Colorimetry • “Assigning numbers to physically defined stimuli” • Milestone in colorimetry: • most of perceived colors can be matched by adding light from three suitable “ pure stimuli ” or “ primary stimuli ” • For each spectral target, the intensity of the primaries can be adjusted to create a match
CIE XYZ: matching functions 1.8 ¯ x 1.6 ¯ y ¯ z 1.4 1.2 Sensitivity 1 0.8 0.6 0.4 0.2 0 400 450 500 550 600 650 700 750 800 λ (nm)
CIE XYZ • The linear combination of the three spectral functions can produce a spectral signal which may visually match to a linear combination of the primaries: I ( λ ) = x ( λ ) X + y ( λ ) Y + z ( λ ) Z Z 830 X = I ( λ ) x ( λ ) d λ 380 Z 830 Y = I ( λ ) y ( λ ) d λ 380 Z 830 Z = I ( λ ) z ( λ ) d λ 380
CIE XYZ: Chromaticities 0.8 0.7 0.6 X x = 0.5 X + Y + Z y Y 0.4 y = D65 X + Y + Z 0.3 0.2 0.1 0.0 0.0 0.1 0.2 0.3 0.4 0.5 0.6 0.7 x
Color Spaces • Two messages: • Mathematical equations creating a relationship between a color triplet and a CIE XYZ color triplet • Defining a color gamut; i.e. what colors can be represented (a volume in the color space)
RGB Color Space • Defining a color as a triplet of specific (device dependent) red, green, and blue primaries with a given white point (wp) • For example, the ITU-R BT.709 has: R x,y = (0 . 64 , 0 . 33) G x,y = (0 . 3 , 0 . 6) B x,y = (0 . 15 , 0 . 06) WP x,y = (0 . 3127 , 0 . 329) • which leads to: X 0 . 412 0 . 358 0 . 181 R = Y 0 . 213 0 . 715 0 . 072 G Z 0 . 019 0 . 119 0 . 950 B
sRGB Color Space • LCD and CRT monitors can not display linear signal; i.e. the relationship, f, between output intensity and input voltage is not linear • f is typically modeled as a gamma function L v = kV γ
sRGB Color Space: visualization on CRT/LCD monitors 1 Normalized luminance output 0.8 0.6 0.4 γ encoded values linear values 0.2 Gamma Linear 0 0 0.1 0.2 0.3 0.4 0.5 0.6 0.7 0.8 0.9 1 Normalized pixel value
Recommend


More recommend
Explore More Topics
Stay informed with curated content and fresh updates.