H517 Visualization Design, Analysis, & Evaluation Week 12: - PowerPoint PPT Presentation
H517 Visualization Design, Analysis, & Evaluation Week 12: Visualization Tasks & Evaluation Khairi Reda | redak@iu.edu School of Informa5cs & Compu5ng, IUPUI Raw user data Processed Data plots Visualization data pre- visual
H517 Visualization Design, Analysis, & Evaluation Week 12: Visualization Tasks & Evaluation Khairi Reda | redak@iu.edu School of Informa5cs & Compu5ng, IUPUI
Raw user data Processed Data plots Visualization data pre- visual processing interaction encoding vis designer
Visualiza/on design process Study Design Evaluate Build
Why study users? Thesis 1: The purpose of visualiza5on is insight, not preDy picture Thesis 2: Visualiza5on enable people to uncover insights by helping them execute a series of tasks on a dataset or answer questions about data
Visualiza/on tasks sense making (next week) fuzzy • Understand and forecast trade paDerns • Explore the rela5onship between the expression of certain genes and cancer prognosis • Analyze the distribu5on of sales • Compare the incidence of asthma in different US states • Iden5fy the state with the highest number of asthma-related hospitaliza5on crisp mid / low-level tasks
emergence Complex sense fuzzy making cognitive reasoning activities forecasting problem solving mid-level browsing categorizing tasks characterizing identifying (distributions) interactions comparing brushing and details-on- linking zooming filtering demand clicking swiping events crisp hovering dragging Sedig et al.
Visualiza/on tasks sense making browsing looking for identifying characterizing outliers clusters trends see detail- navigate zoom out select filter on demand click click drag hover interactive vis visualization state updates time
Domain task abstrac/on • The wording of the task is oPen influenced by the u ser’s domain and background • Despite apparent differences, many tasks can be similar • “Contrast the prognosis of pa5ents who were admiDed to hospital to pa5ents receiving home care/rest” [epidemiologists studying flu] • “See if the results for 5ssue samples treated with LL-37 match up with the ones without pep5de” [biologists studying immune system response] • Both tasks are essen5ally about “comparing averages between two groups” • Task abstrac5on allow us to iden5fy common visualiza5on designs despite apparent domain differences
Domain task abstrac/on {action, target} pairs compare, trends locate, nodes in network browse, distribu5on Based on a slide by Miriah Meyer
Domain task abstrac/on {action, target } pairs
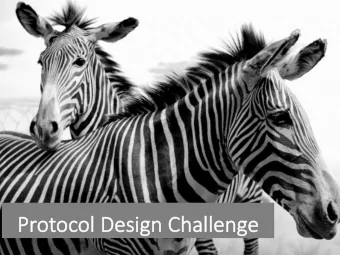
Example of Domain task abstrac/on
Inferring Grevy’s social interac5ons Mayank Lahiri
Domain Tasks • Find communi5es in zebra society, and iden5fy influen5al individuals who play a role in shaping the social structure • Understand how the social structure of Grevy’s zebra evolve over-5me • Understand how Grevy’s zebra society responds to environmental variables
Domain Tasks • Find communi5es in zebra society, and iden5fy influen5al individuals who play a role in shaping the social structure • Understand how the social structure of Ac/on: Find = Explore (unknown target, unknown loca5on) Grevy’s zebra evolve over-5me Target: communi5es (loosely defined: groups of zebras that hang out together) • Understand how Grevy’s zebra society responds to environmental variables Ac/on: Iden5fy = locate (known target, unknown loca5on) Target: influen5al individuals (typically male stallions, or lacta5ng females)
Domain Tasks • Find communi5es in zebra society, and iden5fy influen5al individuals who play a role in shaping the social structure • Understand how the social structure of Grevy’s zebra evolve over-5me • Understand how Grevy’s zebra society Ac/on: Understand = Compare (mostly) responds to environmental variables Target: All communi5es over 5me
Find Communi/es A A A A C C Q Q X X C C Q Q X X A A C C Q Q X X B B B B R R Y Y R R Y Y B B R R Y Y T1 T1 T2 T2 T3 T3
Find Communi/es A A A A C C Q Q X X C C Q Q X X A A C C Q Q X X B B B B R R Y Y R R Y Y B B R R Y Y T1 T1 T2 T2 T3 T3 • Individual are reluctant to switch community - switching cost • Individual are mostly seen with their community - visi/ng cost • Individuals are rarely absent from their community - absence cost
Find Communi/es A A C Q X C Q X A C Q X B B R Y R Y B R Y T1 T2 T3 individuals time Q R X Y group switch community A B C
Time-changing groups individuals community
Domain Tasks • Find communi5es in zebra society, and iden5fy influen5al individuals who play a role in shaping the social structure • Understand how the social structure of Grevy’s zebra evolve over-5me • Understand how Grevy’s zebra society responds to environmental variables Ac/on: Link Target: Communi5es and their geo loca5on
Social structure + geography Social Group movement + structure over space and 5me (communi5es)
Social structure + geography
Evaluation
Visualiza/on design process Study Design Evaluate Build
Why evaluate? cognitive • Evalua/on / valida/on is “about whether you have effect built the right product” • Does it provide new insights about the data? • Is the visualiza5on memorable and/or engaging? • Does it enable users to perform their intended analysis tasks? • Does the visualiza5on enable accurate percep5on of values, distribu5ons, and/or trends in the data? • Is it “easy” to use? Are there any usability issues in the graphical interface? perception / UI mechanics
Visualiza/on design process Study Design Evaluate Build
Four nested levels of vis design Munzner, 2014
Four nested levels of vis design Study domain, interview users, iden/fy needs Munzner, 2014
Four nested levels of vis design Iden/fy tasks and data. Translate from domain-dependent to abstract tasks and data types Munzner, 2014
Four nested levels of vis design Sketch/design visual encoding and interac/on techniques Munzner, 2014
Four nested levels of vis design Implement visualiza/on using code Munzner, 2014
Threats to validity Munzner, 2014
Threats to validity You misunderstood their needs Munzner, 2014
Threats to validity You’re showing them the wrong thing Munzner, 2014
Threats to validity The way you show it doesn’t work Munzner, 2014
Threats to validity Your code is too slow Munzner, 2014
Guard against threats You misunderstood their needs You’re showing them the wrong thing The way you show it doesn’t work Your code is too slow Munzner, 2014
Evalua/ng visualiza/ons is s/ll tricky!
Extra
Evalua/on methods • Evaluate algorithm speed / memory usage • Controlled [lab] studies with any user • Qualita/ve studies • Insight-based evalua/on • Evalua/ng the data analysis process • Field deployment
Controlled [lab] studies - Goal is to typically evaluate graphical percep/on - Allows for comparison between different techniques or representa5ons - Generally provides accurate results, but they may not generalize beyond lab condi5ons or tested tasks - Typically quan/ta/ve in nature • Finely-scoped tasks • Measure user accuracy, performance 5me, and/or subjec5ve preference • Focus is typically on the analysis outcome
Qualita/ve studies - Usually open-ended usage scenarios - Smaller number of par5cipants compared to quan5ta5ve lab studies - More in-depth analysis of how par5cipants use, interact with, and reason about the visualiza5on - Focus is on the analysis process - Analyze videos, audio, or comments from users - Can ask par5cipants to fill surveys, or provide subjec5ve feedback on the visualiza5on - Usually involves domain experts and target audience of the visualiza5on
Insight-based evalua/on - The goal of visualiza5on is to generally generate new insight - Evalua5on should therefore include insight-genera/on - Think-aloud protocols: have the users say what they are thinking - Transcribe and code: - Observa5on - Hypothesis - Ques5on - Exploratory goal
Evalua/ng the data analysis / explora/on process - The focus is on the visual analysis process of users, as opposed to the outcome of the analysis - Want to understand the analy5c dialogue between the user and the data - Want to capture and analyze mul5ple aspects: - Interac/ons with the visualiza/on - Interac5on logs, videos - Reasoning process - Think aloud protocol: have the par5cipant say what they are thinking - Eye gaze behavior
Recommend


![h [.,.] h [.,.] f [.,.] f [.,.] 0 0 0 0 0 0 0 0 0 0 0 0 0 0 0 0 0 0 0 0](https://c.sambuz.com/803426/h-h-s.webp)
More recommend
Explore More Topics
Stay informed with curated content and fresh updates.