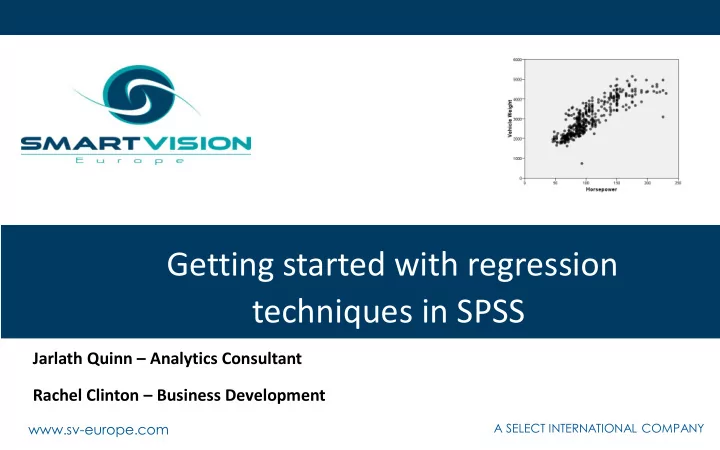

Getting started with regression techniques in SPSS Jarlath Quinn – Analytics Consultant Rachel Clinton – Business Development www.sv-europe.com A SELECT INTERNATIONAL COMPANY
• Premium, accredited partner to IBM specialising in the SPSS Advanced Analytics suite. • Team each has 15 to 20 years of experience working in the predictive analytic space - specifically as senior members of the heritage SPSS team A SELECT INTERNATIONAL COMPANY
Agenda • Overview of regression techniques and linear relationships • Performing a simple linear regression • Using multiple linear regression to make predictions • Predicting response likelihood with logistic regression A SELECT INTERNATIONAL COMPANY
What do we mean by ‘Regression’? • A family of statistical techniques used to predict outcomes and generate estimates for hundreds of applications • Linear regression is used – When the outcome is continuous (or scale) data – The relationships between the fields can be described using straight lines • Non linear regression – Is used when the outcome itself is not linear (such as a category) – Often takes the form of logistic regression A SELECT INTERNATIONAL COMPANY
Where are regression techniques used? • Modelling the relationship between promotion spend and revenue • Estimating pollution levels following heavy rainfall • Predicting tourism revenue based on exchange rates and air travel costs • Predicting student test scores based on previous test results and peer-group performance • Estimating website hits based on re-tweets and follower numbers • Predicting sales of barbeques based on temperature forecasts A SELECT INTERNATIONAL COMPANY
Regression to the mean A SELECT INTERNATIONAL COMPANY
Regression to the mean *jittered points A SELECT INTERNATIONAL COMPANY
Regression to the mean A SELECT INTERNATIONAL COMPANY
Regression to the mean A SELECT INTERNATIONAL COMPANY
Regression to the mean } The regression line is drawn so it that minimises the differences between the points and line itself ( this is called the line of least squares) A SELECT INTERNATIONAL COMPANY
Regression to the mean * • But be careful… • It is just an average after all… * Anscombe’s Quartet A SELECT INTERNATIONAL COMPANY
Measuring linear relationships 0.859 0.434 -.701 Pearson correlation values A SELECT INTERNATIONAL COMPANY
Non-linear relationships -.671 -0.005 Pearson correlation values A SELECT INTERNATIONAL COMPANY
Correlations as percentages • Correlation = 0.859 • 0.859 x 0.859 = 0.738 • 0.738 = 73.8 % • Correlation Squared = ‘R Square’ 73.8% A SELECT INTERNATIONAL COMPANY
From correlation to prediction How can we express linear relationships as predictive models? A SELECT INTERNATIONAL COMPANY
How long does it take to cook a chicken? www.sv-europe.com A SELECT INTERNATIONAL COMPANY
How long does it take to cook a chicken? • y = m x + c 7 minutes per pound plus 45 minutes or y = a + b x • 20 minutes per pound plus 20 minutes A SELECT INTERNATIONAL COMPANY
A SELECT INTERNATIONAL COMPANY
Lets look at a demo of linear regression in IBM SPSS Statistics www.sv-europe.com A SELECT INTERNATIONAL COMPANY
How can we predict category outcomes? www.sv-europe.com A SELECT INTERNATIONAL COMPANY
Logistic regression • Allows us to predict things that linear regression can’t • Such as… – Response to a marketing campaign – Credit risk – Whether a subscriber is likely to renew a service – Risk of equipment failure – How likely is it that a particular patient will be readmitted to hospital – Whether a charity donor will switch to direct debit A SELECT INTERNATIONAL COMPANY
Logistic regression • But…. • These outcomes are not continuous numbers so standard linear regression won’t work • When the outcome consists of two categories we use binary logistic regression • When the outcome has three or more categories we use multinomial logistic regression • Logistic gets around the limitations of describing relationships with straight lines by using a special sigmoid curve A SELECT INTERNATIONAL COMPANY
Logistic regression Probability of Responding Discount % 00 A SELECT INTERNATIONAL COMPANY
IBM SPSS Regression Module and R integration • Using the SPSS Regression Module we can go beyond Linear Regression and unlock many other types of Regression functionality A SELECT INTERNATIONAL COMPANY
Exclusive Smart Vision bundle offers Regression add-on pack SPSS & Regression starter pack • • If you already have SPSS base and If you do not have SPSS base licence add the regression module to your already. Purchase Base & Regression licence… – 1 user perpetual licence + 1 st – 1 user perpetual licence + 1 st year support + 2 days year support + 1 day personalised training personalised training – £4,229 (+ VAT) – £2,900 (+ VAT) – Saving £1,000 on IBM list price – Saving £500 on IBM list price – Offer code SVRegSP002 – Offer code SVRegSP001 A SELECT INTERNATIONAL COMPANY
Working with Smart Vision Europe Ltd • As a premier partner we sell the IBM SPSS suite of software to you directly – We’re agile, responsive and generally easier to deal with • As experts in SPSS / analytics / predictive analytics we will – Deliver classroom training courses – Offer side by side training support – Offer “skills transfer” consulting – Run booster and refresher sessions to get more from your SPSS licences – Give no strings attached advice • We are a support providing partner so if you already have SPSS you can source your technical support directly from us (identical costs to IBM) – We offer telephone support with real people as well as web tickets / email queries – We offer “how to” support to help you get moving on your project quickly A SELECT INTERNATIONAL COMPANY
Contact us: +44 (0)207 786 3568 info@sv-europe.com Twitter: @sveurope Follow us on Linked In Sign up for our Newsletter Thank you www.sv-europe.com A SELECT INTERNATIONAL COMPANY
Recommend
More recommend