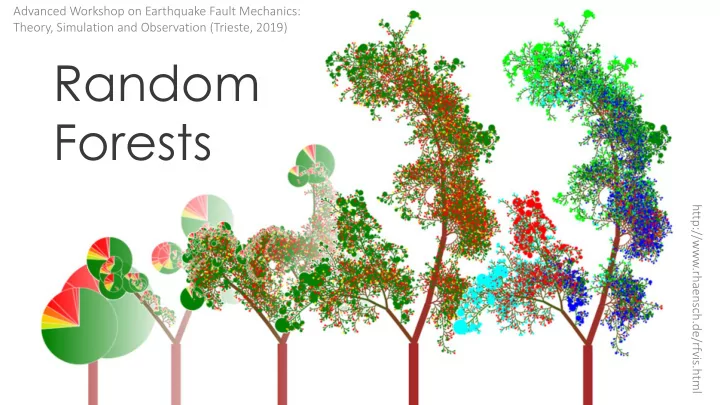

Advanced Workshop on Earthquake Fault Mechanics: Theory, Simulation and Observation (Trieste, 2019) Random Forests http://www.rhaensch.de/rfvis.html
AI vs. ML vs. DL Art rtif ific icia ial l In Intell llig igence (AI) I) Machin ine Le Learnin ing (M (ML) L) • Chess computers • Random Forests • Support Vector Machines • Computer games • Robotics Deep Le Learnin ing (D (DL) L) • Decision policies Neural Networks with many (up to hundreds) of “layers”
What’s the difference? • Neural Networks make decisions based on… well… something • Random Forests (RF) make decisions based on well-defined rules • RFs are easier to interpret, decision process can be visualised • … but RFs require a particular type of input
Example: Anderson’s Irises Iris virginica Iris versicolor Iris setosa Wikipedia
Example: Anderson’s Irises https://en.wikipedia.org/wiki/Sepal Sepal width Petal width
Sepal width Petal width
Sepal width Is the petal width < 2 cm? Yes No Petal width
Yes Sepal width No Is the sepal width > 1 cm? Petal width
Decision Trees Is the petal width < 2 cm? Is the sepal width > 1 cm?
Sepal width Petal width
Sepal width Is the petal width > 3 cm? No Yes Petal width
Decision Trees Is the petal width < 2 cm? Is the sepal width > 1 cm? Is the petal width > 3 cm?
Sepal width Petal width
Sepal width Petal width
RF: Democracy of Decision Trees • Decision Trees make decisions that split the data most efficiently • Two trees with different data will make different decisions • Random Forests: • Create 𝑂 Decision Trees • Give each tree a different subset of the data (randomly) • Average the predictions of all the trees in the “forest”
Visualise feature importance • Input data has “features” (sepal width/length, petal width/length) • Which of these features is most important?
Sepal length Sepal width Petal width Petal length
Visualise feature importance • Input data has “features” (sepal width/length, petal width/length) • Which of these features is most important? • With RFs it is possible to “calculate” relative importance of features
Application of RF
Application of RF
Rouet-Leduc et al. (2018) Application of RF
RFs only accept “features” • RFs are not suitable to analyse time series data (seismograms, GPS) or higher-dimensional data (spectrograms, images) • Quality of predictions depends on selected features (“feature engineering”) • Interpretation of certain features not always obvious • What is the meaning of the kurtosis of the signal squared?
RF vs DL • Random Forests are more interpretable, and are usually easier/faster to train (+ require less data) • DL facilitates a wide range of architectures to handle different types of data, and are more flexible • Pick the right tool for the job!
Tutorial: Estimating EQ Damage • After the 2015 Gorkha earthquake (M w 7.8) the Nepalese government initiated a large survey of the structural damage across the country • For each building, the damage was classified as 1. No/little damage 2. Moderately damaged 3. Severely damaged DrivenData.org
Tutorial: Estimating EQ Damage • In addition, various socio-economical factors were recorded: • Building’s surface area, height, number of floors • Construction materials, foundation type • Primary use (residential, governmental, educational) • Number of families • Etc.
Tutorial: Estimating EQ Damage DrivenData Challenge: Given the socio-economical factors (= features), predict the damage class of the building (1, 2, 3)
Recommend
More recommend