for In-System Debug of High-Level Synthesis Circuits Jeffrey - PDF document
2016-09-15 Quantifying Observability for In-System Debug of High-Level Synthesis Circuits Jeffrey Goeders Steve Wilton 1 What this talk is about Recent work: Software-level, in-system debugging of HLS circuits How do you measure the
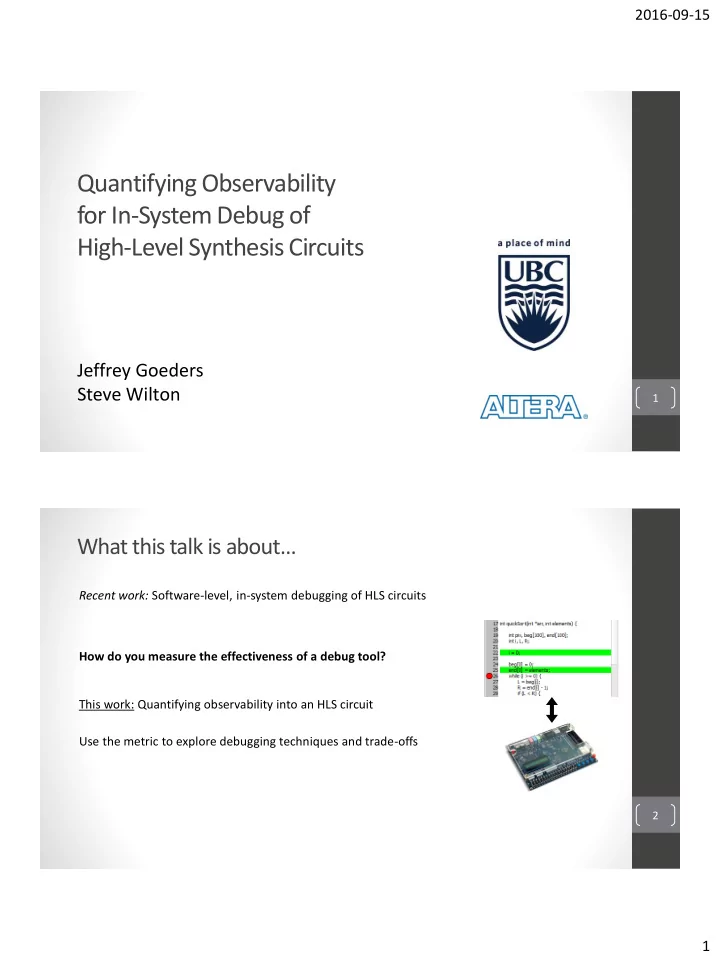
2016-09-15 Quantifying Observability for In-System Debug of High-Level Synthesis Circuits Jeffrey Goeders Steve Wilton 1 What this talk is about… Recent work: Software-level, in-system debugging of HLS circuits How do you measure the effectiveness of a debug tool? This work: Quantifying observability into an HLS circuit Use the metric to explore debugging techniques and trade-offs 2 1
2016-09-15 High-Level Synthesis High-Level Synthesis (HLS) Hardware Software (FPGA) Software designers need more than a compiler • They need tools for t esting, debugging, optimization…. My PhD work: Debugging HLS circuits Why this is challenging: 1. Circuit looks nothing like the original software 3 2. Debugging hardware is difficult – limited observability into chip Bugs in HLS systems Kernel-level bugs Debug C code on Software main() { • Self-contained workstation (gdb). int i; • Easy to reproduce } HLS RTL Verification Run C/RTL co-simulation Simulation • Verify RTL correctness on workstation. HLS Generated • Catch tool usage errors RTL System-Level Bugs Debug on FPGA I/O Devices • Bugs in interfaces FPGA • Dependent on I/O traffic (Requires observing Hardware HLS Generated • Hard to reproduce, or internals of FPGA) Hardware require long run times 4 Other Other How do you observe Hardware Hardware these bugs? 2
2016-09-15 Can We Use Hardware Debug Tools? Embedded Logic Analyzer (SignalTap/Chipscope): Your Debug Tool: RTL - Chooses signals to trace Circuit - Debug circuitry added Run 5 Designer is forced to debug using the RTL, which is nothing like the ‘C’ code Our Approach 1. A software-like debugger running on a workstation • Single-stepping, breakpoints, inspect variables 2. Interacting with the circuit on the FPGA • Capture system-level bugs in the real operating environment 6 3
2016-09-15 Key: If we want to capture system bugs, the circuit needs to execute at normal speed (MHz) • Makes ‘interactive debugging’ impossible Solution: Record and Replay • Record circuit execution on-chip, retrieve, debug using the recorded data HLS 2. Stop and retrieve 1. Execute and record On-Chip Memory 3. Debug using the recorded data 7 Limited on-chip memory: Can only observe a small portion of entire exectuion Embedded Logic Analyzers • Example: Chipscope/Signaltap • Record (trace) signals into on-chip memory • Trace Buffers • Memory configured as a cyclic buffer • Each cycle, store samples of all signals of interest Signals of interest Cycle i Cycle i+1 Cycle i+2 8 Cycle i+3 Cycle i+4 4
2016-09-15 Leveraging the HLS Information Embedded Logic Analyzer Our Architecture Datapath Datapath r 9 r 8 r 7 r 6 r 5 r 4 r 3 r 2 r 1 r 9 r 8 r 7 r 6 r 5 r 4 r 3 r 2 r 1 Current Trace Scheduler ~40-200X State r 9 r 8 r 7 r 6 r 5 r 4 r 3 r 2 r 1 more r 9 r 8 r 7 r 6 r 5 r 4 r 3 r 2 r 1 State Active Registers memory r 9 r 8 r 7 r 6 r 5 r 4 r 3 r 2 r 1 r 2 r 1 S1 efficient r 9 r 8 r 7 r 6 r 5 r 4 r 3 r 2 r 1 r 7 r 6 r 3 S2 r 9 r 8 r 7 r 6 r 5 r 4 r 3 r 2 r 1 r 9 r 10 r 8 S5 r 11 S6 Dynamically change which signals are recorded each cycle 9 • HLS schedule is used to only record variable updates • Longer execution trace Find bugs faster HLS Observability Usually not possible to provide “complete observability” • Limited on-chip memory • What data should be given to the user? What should be ignored? Why have an observability metric? • Compare and contrast debug techniques; understand relative strengths • Toward debug techniques tailored to the design/bug Observability metrics have been proposed for RTL circuits • Issue: ‘RTL’ observability not meaningful in the software domain Need an observability metric for HLS circuits, based upon the original software code. 10 5
2016-09-15 Observability Metric What does our metric measure? • As a user steps through a pro rogr gram, how ow of often are re the values of of varia riable acce cesses availa ilable? Why this approach? • Recent debug work: software-like debug experience We define Observability as: 𝑃𝑐𝑡𝑓𝑠𝑤𝑏𝑐𝑗𝑚𝑗𝑢𝑧 = 𝐵𝑤𝑏𝑗𝑚𝑏𝑐𝑗𝑚𝑗𝑢𝑧 ⋅ 𝐸𝑣𝑠𝑏𝑢𝑗𝑝𝑜 How many cycles is the data available for? What percentage of variable accesses have 11 recorded values available to the user? Observability Metric 𝑃𝑐𝑡𝑓𝑠𝑤𝑏𝑐𝑗𝑚𝑗𝑢𝑧 = 𝐵𝑤𝑏𝑗𝑚𝑏𝑐𝑗𝑚𝑗𝑢𝑧 ⋅ 𝐸𝑣𝑠𝑏𝑢𝑗𝑝𝑜 𝑤 𝑗 : Variable accesses with known value 𝐵𝑤𝑏𝑗𝑚𝑏𝑐𝑗𝑚𝑗𝑢𝑧 𝐵 = σ 𝑗∈𝑤𝑏𝑠 𝑔 𝑗 ⋅ 𝑤 𝑗 𝑏 𝑗 : Total number of variable accesses σ 𝑗∈𝑤𝑏𝑠 𝑔 𝑗 ⋅ 𝑏 𝑗 𝑔 𝑗 : Variable favorability coefficient 𝐸𝑣𝑠𝑏𝑢𝑗𝑝𝑜 = 𝑓 𝑢𝑐 ⋅ 𝑁𝑓𝑛𝑝𝑠𝑧 𝑇𝑗𝑨𝑓 (kb) 𝑓 𝑢𝑐 : Memory efficiency (cycles captured per kB of memory) 12 𝑃𝑐𝑡𝑓𝑠𝑤𝑏𝑐𝑗𝑚𝑗𝑢𝑧 𝑞𝑓𝑠 𝑙𝑐 = 𝐵 ⋅ 𝑓 𝑢𝑐 6
2016-09-15 Observability provided by an Embedded Logic Analyzer Signals of interest 𝑃𝑐𝑡𝑓𝑠𝑤𝑏𝑐𝑗𝑚𝑗𝑢𝑧 𝑞𝑓𝑠 𝑙𝑐 = 𝐵 ⋅ 𝑓 𝑢𝑐 • 𝐵 = 100% Cycle i 1𝑙 • 𝑓 𝑢𝑐 = Cycle i+1 # 𝐶𝑗𝑢𝑡 𝑈𝑠𝑏𝑑𝑓𝑒 Cycle i+2 Cycle i+3 Cycle i+4 Methodology: • CHStone benchmarks, LegUp 4.0 • Record ALL ‘C’ variables Result: • 𝑃𝑐𝑡𝑓𝑠𝑤𝑏𝑐𝑗𝑚𝑗𝑢𝑧 𝑞𝑓𝑠 𝑙𝑐 = 100% ⋅ 0.5 𝑑𝑧𝑑𝑚𝑓𝑡/𝑙𝑐 13 Observability Results Availability Duration 100% 25.0 90% 80% 20.0 70% Cycles/Kb 60% 15.0 50% 40% 10.0 30% 20% 5.0 10% 0% 0.0 Availability Duration vs. ELA 1. Embedded Logic Analyzer 100% ⋅ 0.5cyl/kb 1x 14 7
2016-09-15 Observability of Dynamic Tracing Scheme Our recent work: • Use HLS schedule to only record variable updates Datapath If we record all variable updates, is Availability 100%? r 9 r 8 r 7 r 6 r 5 r 4 r 3 r 2 r 1 Current Trace Scheduler State State Active Registers r 1 S1 r 3 r 2 S2 r 9 r 8 r 7 r 6 S5 r 10 S6 r 3 r 2 S2 15 Issue with Only Recording Updates 𝟖 𝟘 = 𝟖𝟗% Variables updates may occur outside of captured trace 𝑩 = ൗ • During debug, these variable values are not available to the user More likely to occur if: 16 • Long gaps of time from update to access • Trace buffers are small 8
2016-09-15 Availability (%) – Record Updates Only 17 10kb Trace Memory Observability Results Availability Duration 100% 25.0 90% 80% 20.0 70% Cycles/Kb 60% 15.0 50% 40% 10.0 30% 20% 5.0 10% 0% 0.0 Availability Duration vs. ELA 1. Embedded Logic Analyzer 100% ⋅ 0.5cyl/kb 1x 2. Record “Updates” 88% ⋅ 22.0cyl/kb 38x 18 9
2016-09-15 Which variables cause this issue? #define N 100 Local/Scalar Variables: int matrix_multiply(int * fifo_in) { int i, j, k, sum; • Shorter lifespan, often accessed soon after int A[N][N], B[N][N], C[N][N]; updating for (i = 0; i < N; i++) • Typically mapped to registers in the hardware for (j = 0; j < N; j++) A[i][j] = *fifo_in; for (i = 0; i < N; i++) Global/Vector Variables: for (j = 0; j < N; j++) B[i][j] = *fifo_in;; • Longer lifespan, may be accessed long after being initialized/updated for (i = 0; c < m; c++) { for (j = 0; d < q; d++) { • Typically mapped to memories in the hardware sum = 0; for (k = 0; k < p; k++) { sum += A[i][k]*B[k][j]; } C[i][j] = sum; } 19 } return 0; } Availability (%) – Record Updates Only 20 10
2016-09-15 Availability (%) – Record Updates Only Variables in Registers Variables in Memory 21 Recording “Updates Only” works well for variables in registers, but has issues for variables in memory Availability (%) – Record Updates + Memory Reads Record when variables are read as well as written • First, consider memory reads only 10kb Trace • Provides better availability (at a cost of duration) Memory Record “Updates + Mem Reads” Record “Updates Only” 22 11
2016-09-15 Observability Results Availability Duration 100% 25.0 90% 80% 20.0 70% Cycles/Kb 60% 15.0 50% 40% 10.0 30% 20% 5.0 10% 0% 0.0 Availability Duration vs. ELA 1. Embedded Logic Analyzer 100% ⋅ 0.5cyl/kb 1x 2. Record “Updates” 88% ⋅ 22.0cyl/kb 38x 23 ⋅ 3. Record “Updates + Mem Reads” 98% 12.0cyl/kb 24x 4. Record “Updates + Reads” 100% ⋅ 7.7cyl/kb 14x Observing a Subset of Variables What happens to observability if we only observe a subset of variables? 10%? 90%? Selecting RTL signals for an Embedded Logic Analyzer Predictable effect on observability Selecting ‘C’ variables to observe non-uniform effect on observability: • Bit-width minimization • 1 Variable in C code Many signal in hardware: • LLVM SSA form creates new register/signal for each assignment • Many Variables in C code 1 Signal in hardware: • Function parameters • In-lining 24 12
Recommend
More recommend
Explore More Topics
Stay informed with curated content and fresh updates.


