Final Exam Review PA7 is due tomorrow, Friday Dec 8 at 11:55 PM Sta - PowerPoint PPT Presentation
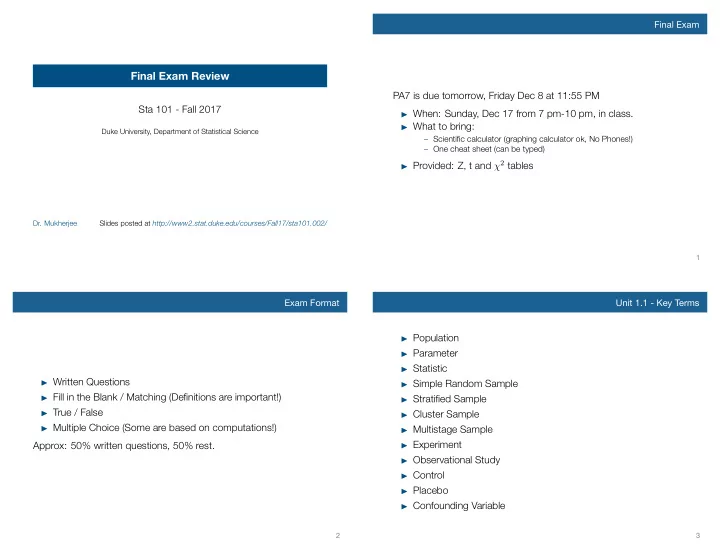
Final Exam Final Exam Review PA7 is due tomorrow, Friday Dec 8 at 11:55 PM Sta 101 - Fall 2017 When: Sunday, Dec 17 from 7 pm-10 pm, in class. What to bring: Duke University, Department of Statistical Science Scientific calculator
Final Exam Final Exam Review PA7 is due tomorrow, Friday Dec 8 at 11:55 PM Sta 101 - Fall 2017 ▶ When: Sunday, Dec 17 from 7 pm-10 pm, in class. ▶ What to bring: Duke University, Department of Statistical Science – Scientific calculator (graphing calculator ok, No Phones!) – One cheat sheet (can be typed) ▶ Provided: Z, t and χ 2 tables Dr. Mukherjee Slides posted at http://www2.stat.duke.edu/courses/Fall17/sta101.002/ 1 Exam Format Unit 1.1 - Key Terms ▶ Population ▶ Parameter ▶ Statistic ▶ Written Questions ▶ Simple Random Sample ▶ Fill in the Blank / Matching (Definitions are important!) ▶ Stratified Sample ▶ True / False ▶ Cluster Sample ▶ Multiple Choice (Some are based on computations!) ▶ Multistage Sample ▶ Experiment Approx: 50% written questions, 50% rest. ▶ Observational Study ▶ Control ▶ Placebo ▶ Confounding Variable 2 3
Unit 1.1 - Data Collection, Observational Studies & Experiments Clicker question Bayesian inference A recent research study randomly divided participants into Design of studies Frequentist inference groups who were told that they were given different levels of most (CLT & simulation) Exploratory Inference numerical Vitamin E to take daily. Actually, one group received only a data ideal analysis one mean & median two means & medians Random No random observational placebo pill, and the other received Vitamin E. The research study many means Probability categorical experiment followed the participants for eight years to see how many assignment assignment one proportion studies two proportions many proportions developed a particular type of cancer during that time period. Modeling (numerical response) Which of the following responses gives the best explanation as to 1 explanatory many explanatory No causal conclusion, Random Causal conclusion, the purpose of the random assignment in this study? correlation statement Generalizability generalized to the whole sampling generalized to the whole population. population. No random No causal conclusion, No (a) To prevent skewness in the results. Causal conclusion, correlation statement only sampling only for the sample. generalizability (b) To reduce the amount of sampling variability. for the sample. (c) To ensure that all potential cancer patients had an equal chance of being bad most selected for the study. Causation Correlation observational experiments (d) To produce treatment groups with similar characteristics. studies (e) To ensure that the sample is representative of all cancer patients. 4 5 Unit 1.2 - Exploratory Data Analysis Unit 1.2 - Exploratory Data Analysis Robust statistics: Describing Distributions of Numerical Variables: ▶ Mean and standard deviation are easily affected by extreme ▶ Shape : skewness, modality observations since the value of each data point contributes to ▶ Center : an estimate of a typical observation in the distribution their calculation. (mean, median, mode, etc.) ▶ Median and IQR are more robust. – Notation: µ : population mean, ¯ x : sample mean ▶ Therefore we choose median & IQR (over mean & SD) when ▶ Spread : measure of variability in the distribution (standard describing skewed distributions. deviation, IQR, range, etc.) Weighted Mean: [Refer: PS1, problem no. 1.44 (b)] ▶ Unusual observations : observations that stand out from the Mean of n 1 observations = ¯ x 1 rest of the data that may be suspected outliers Mean of n 2 observations = ¯ x 2 , then ▶ Skewed distribution : Right skewed- mean > median Left skewed- mean < median Mean of n 1 + n 2 observations = n 1 ¯ x 1 + n 2 ¯ x 2 n 1 + n 2 6 7
Unit 1.3 - More Exploratory Data Analysis Bayesian inference Design Use segmented bar plots for visualizing relationships of studies Frequentist inference (CLT & simulation) Exploratory Inference numerical Clicker question data between 2 categorical variables analysis one mean & median two means & medians many means Which of the following is false? Probability categorical one proportion What do the heights of the segments represent? Is there a two proportions many proportions Modeling (numerical response) relationship between class year and relationship status? What 1 explanatory many explanatory descriptive statistics can we use to summarize these data? Do the widths of the bars represent anything? (a) Box plots are useful for highlighting outliers, but we cannot determine skew based on a box plot. (b) Median and IQR are more robust statistics than mean and SD, respectively, Relationship status vs. class year since they are not affected by outliers or extreme skewness. 30 (c) When the response variable is extremely right skewed, it may be useful to apply relationship_status a log transformation to obtain a more symmetric distribution, and model the count yes 20 logged data. no (d) Segmented frequency bar plots are “good enough” for evaluating the it's complicated 10 relationship between two categorical variables if the sample sizes are the same for various levels of the explanatory variable. 0 First−year Sophomore Junior Senior Class year 8 9 Unit 1.3 - More Exploratory Data Analysis Unit 1.3 - More Exploratory Data Analysis ...or use a mosaic plot Use side-by-side box plots to visualize relationships between a numerical and categorical variable What do the widths of the bars represent? What about the heights of the boxes? Is there a relationship between class year and How do drinking habits of vegetarian vs. non-vegetarian students relationship status? What other tools could we use to summarize compare? these data? Nights drinking/week vs. vegetarianism Relationship status vs. class year 6 ● First−year Sophomore Junior Senior yes ● nights drinking 4 2 no 0 no yes vegetarian it's complicated 10 11
Unit 1.4 - Introduction to Statistical Inference 2.1 - Probability and Conditional Probability ▶ Disjoint (mutually exclusive) events cannot happen at the same time – For disjoint A and B: P ( A and B ) = 0 ▶ If A and B are independent events , having information on A Key Ideas: does not tell us anything about B (and vice versa) ▶ Observed differences may be due to random chance – If A and B are independent: ▶ Test whether difference is significant using simulations • P ( A | B ) = P ( A ) • P ( A and B ) = P ( A ) × P ( B ) ▶ General addition rule: P(A or B) = P(A) + P(B) - P(A and B) ▶ Bayes’ theorem: P ( A | B ) = P ( A and B ) P ( B ) 12 13 Unit 2.1 - Bayes' Theorem and Bayesian Inference Bayesian inference About 30% of human twins are identical and the rest are fraternal. Design of studies Identical twins are necessarily the same sex – half are males and Frequentist inference (CLT & simulation) Exploratory numerical Inference the other half are females. One-quarter of fraternal twins are both data analysis one mean & median two means & medians male, one-quarter both female, and one-half are mixes: one many means Probability categorical ▶ Probability trees are useful for organizing information in male, one female. You have just become a parent of twins and one proportion two proportions are told they are both girls. Given this information, what is the many proportions conditional probability calculations Modeling (numerical response) posterior probability that they are identical? 1 explanatory many explanatory ▶ They’re especially useful in cases where you know P(A | B), Type of twins Gender along with some other information, and you’re asked for P(B | A) P ( iden & f ) males, 0.5 0.3*0.5 = 0.15 P ( iden | f ) = P ( f ) ▶ Using Bayes’ theorem identical, 0.3 females, 0.5 0.3*0.5 = 0.15 0 . 15 = P ( hypothesis and data ) male&female, 0.0 0 . 15 + 0 . 175 0.3*0 = 0 P ( hypothesis | data ) = = 0 . 46 P ( data ) P ( data | hypothesis ) × P ( hypothesis ) males, 0.25 0.7*0.25 = 0.175 = P ( data ) fraternal, 0.7 females, 0.25 0.7*0.25 = 0.175 male&female, 0.50 0.7*0.5 = 0.35 14 15
Recommend
More recommend
Explore More Topics
Stay informed with curated content and fresh updates.
