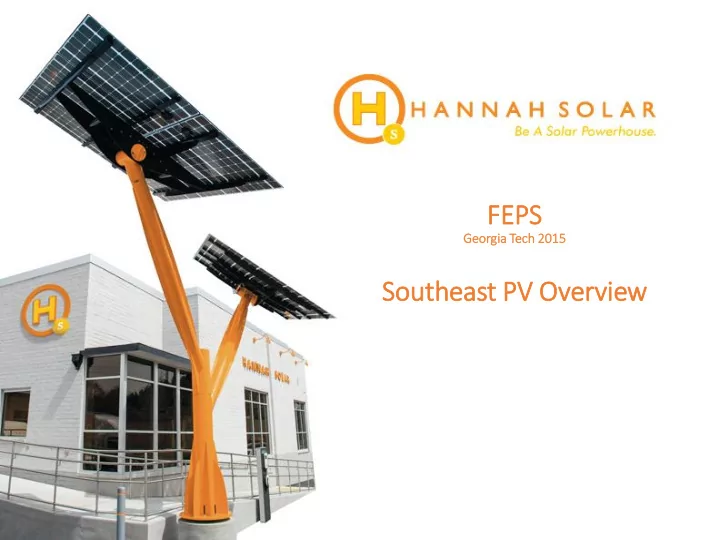

FEPS Georgi gia Tec ech 20 2015 15 So Southeast PV Overv rview
Top US States in in 2013 Source: GTM/SEIA 2
Top op 25 25 in installe lled more than than 445 445 MW of of So Sola lar PV 2013 Stats Other Notable Industrials: • Anheuser Busch • Boeing • Coca-Cola • Del-Monte Foods • Google • Mars • Merck • Pepsi In the USA, up from about 300 MW last year.
The ‘New’ Cost of Solar Source: Future of Power in the South (FEPS) By Dr. Marilyn Brown, GA Tech
Another Record Year in in US S an and Lo Lower Cos osts Source: GTM/SEIA 5
Solar Growth 6
Installed PV Cost Reduction 7
The Future Is Today & The Landscape has Changed! Residential Solarize Programs Community Solar Utility Scale Solar Commercial & Industrial 8
The Future Is Today Storage & EV - Cost of Storage? Value of Storage? Compensation for Storage? 9
Economics & Sustainability T wo key metrics driving the adoption of Solar & Electric Vehicles White Oak Pastures, 50KW Solar Barn, Bluffton, GA Brinson Farms, 100KW Solar Array – Irrigation Pivot Offset, Brinson, GA
PV4EV Features Benefits Solar PV canopy over cars Property differentiation, PR An attractive structure Brand exposure for an advertiser EV charging stations Advertising revenue Advertising media EV drivers will seek & frequent Financing Association with clean energy Marketing assistance Solar revenue & ROI Shade and rain cover
PV Parking Canopy Market Growth • The solar carport market has become an increasingly substantial sector, growing to 157 MW in 2013. • 2014 is expected to be the fourth consecutive year during which greater than 100 MW of solar carport installations were installed. • Historically seen as a niche market, exploited state-level incentives to grow the market at a CAGR of 45% from 2010 to 2014. GTM Report Sept’14. Historic 4 th Ward Park ATLANTA BELTLINE ATLANTA, GA DH Stanton Park
LCOE as a Function of System Cost and Solar Insolation 40 $6/W Hawaii $5/W 35 $4/W $3/W 30 $2/W LCOE (cents/kWh) $1.25/W 25 2010 20 New York 15 2012 Massachusets California Georgia Michigan 10 Delaware Florida Arizona Texas 2013 Colorado Illinois 2020 5 0 1000 1300 1600 1900 2200 2500 Annual Insolation (kWh/m 2 /yr)
Delivered cost per kilowatt hour (kWh) With no incentives 2007 2009 2012 $8 /Watt Installed $6.25 /Watt Installed $3.00 /Watt Installed 100KW = $800,000 100KW = $625,000 100KW = $300,000 Generates 160,000 kWh/year Generates 160,000 kWh/year Generates 160,000 kWh/year 30 Year Generation = 4.8m 30 Year Generation = 4.8m 30 Year Generation = 4.8m Cost Per kWh = $.19/kWh * Cost Per kWh = $.15/kWh * Cost Per kWh = $.08/kWh * * Assumes 30 years of operation & maintenance and capital at 6%.
Delivered cost per kilowatt hour (kWh) 2014 Actual With incentives 2014 $254,416 Project Cost $2.54 /Watt Installed -$241,695 (Tax Credit) 100KW = $254,416 Generates 144,000 kWh/year = $12,721 30 Year Generation = 4.32mW = .001 per kWh FIXED 30 Yrs. Cost Per kWh = $.05/kWh * * Assumes 30 years of operation & maintenance and capital at 6%.
Solar Canopy Solutions Camp Lejeune Marine Base Size:742 kw Location: Camp Lejeune US Marine Base, New River, NC Client: Dept. of Defense Installation Time: 2 months Project Date: April, 2014 Modules: Suniva Mounting: Solaire Canopy
Solar Overview Presentation Thank You 2014
Contact Information Hannah Solar, 1311 Collier Road Atlanta, GA 30318; Direct phone: 404.609.7005 • Peter Marte, CEO • Pete.marte@hannahsolar.com 678-860-8042 19
Recommend
More recommend