Fast Growing Economies: A Turkish Perspective Ali BABACAN Deputy - PowerPoint PPT Presentation
Fast Growing Economies: A Turkish Perspective Ali BABACAN Deputy Prime Minister Republic of Turkey September 20, 2012 EMERGING MARKETS vs DEVELOPED ECONOMIES 2 Growth Divergence GDP Growth Rate (percent) 9 Emerging and Developing
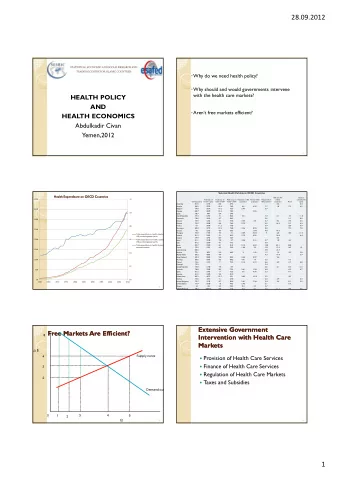
Fast Growing Economies: A Turkish Perspective Ali BABACAN Deputy Prime Minister Republic of Turkey September 20, 2012
EMERGING MARKETS vs DEVELOPED ECONOMIES 2
Growth Divergence GDP Growth Rate (percent) 9 Emerging and Developing Economies 7 5 Advanced Economies 3 1 -1 -3 -5 2000 2001 2002 2003 2004 2005 2006 2007 2008 2009 2010 2011 3 Source: IMF
Seismic Shift in the Global Economy Share of global GDP (based on PPP adjusted GDP, percent) 65 60 Advanced Economies 55 50 45 Emerging and Developing Economies 40 35 30 2000 2001 2002 2003 2004 2005 2006 2007 2008 2009 2010 2011 4 Source: IMF.
Economic Centre of Gravity 5 Source: McKinsey “Urban World: Cities and the rise of the consuming class”.
Total Trade Volume (2000=100) 270 250 Emerging and Developing Economies 230 210 190 170 150 130 Advanced Economies 110 90 70 2000 2001 2002 2003 2004 2005 2006 2007 2008 2009 2010 2011 6 Source: World Bank.
Drivers of Outperformance (1) General Government Budget Deficit (*) (percent of GDP) 10 Advanced Economies 8 6 Emerging and Developing Economies 4 2 0 -2 2000 2001 2002 2003 2004 2005 2006 2007 2008 2009 2010 2011 (*) General government net borrowing. 7 Source: IMF.
Drivers of Outperformance (2) General Government Gross Debt (percent of GDP) 110 55 50 100 Advanced Economies (LHS) 45 90 40 35 80 Emerging and Developing 30 Economies (RHS) 70 25 60 20 2000 2001 2002 2003 2004 2005 2006 2007 2008 2009 2010 2011 8 Source: IMF.
TURKISH EXPERIENCE 9
What Turkey Has Done Before 2008: n Fiscal adjustment n Price stability n Banking reform n Social security reform n Health care reform n Public finance reform 10
What Turkey Has Done During the 2008-2009 Crisis: n Entered the crisis with strong public finance and strong banking sector n Political stability n Strong political will n Medium Term Program (MTP) n Fiscal consolidation n Prudent monetary policy n Effective use of macro-prudential measures 11
Sharp Economic Bounce Back GDP Growth Rate (year-on-year change, percent) 12 10 9.2 8.5 8 6 5.0 5.0 4.0 4 2 0 2010 2011 2012(*) 2013(*) 2014(*) (*) Medium Term Program forecasts 12 Source: TURKSTAT, Ministry of Development.
Positive Decoupling GDP (Real, 2007=100) 150 TURKEY 140 130 U.S. 120 UK 110 EU JAPAN 100 90 2007 2008 2009 2010 2011 2012 2013 2014 2015 2016 2017 13 Source: IMF.
Source: OECD. 0 1 2 3 4 5 6 %5.2 Turkey Chile Australia Norway Mexico Korea Average Growth Expected in OECD Countries Strong Growth Prospects Estonia Slovak Rep. Poland Israel Luxembourg (2012-2017, percent) United States Ireland Sweden Czech Rep. New Zealand Canada Iceland Spain France Hungary Finland Switzerland U.K. Austria Belgium Netherlands Total OECD: 2.4 percent Germany Greece Slovenia Denmark Japan Portugal 14 Italy
100 110 120 130 Source: TURKSTAT, CBRT. (*) Natural logarithm 50 60 70 80 90 1996Q1 1997Q1 Potential Growth: Capital Stock and Labor (fixed prices, 2007 = 100) 1998Q1 1999Q1 Capital Stock (*) Trend 2000Q1 2001Q1 2002Q1 2003Q1 2004Q1 2005Q1 2006Q1 2007Q1 2008Q1 2009Q1 2010Q1 2011Q1 2012Q1 44 45 46 47 48 49 50 51 Source: TURKSTAT, CBRT. (*) Seasonally Adjusted. Jan-2005 Laborforce Participation Rate (*) Jun-2005 Nov-2005 Apr-2006 Sep-2006 Trend Feb-2007 Jul-2007 Dec-2007 May-2008 (%) Oct-2008 Mar-2009 Aug-2009 Jan-2010 Jun-2010 Nov-2010 Apr-2011 Sep-2011 Feb-2012 15
Demographic Projections (Working Age Population*, 2011=100) 130 Turkey 120 110 Northern Europe 100 Western Europe 90 80 Europe 70 60 2011 2015 2020 2025 2030 2035 2040 2045 2050 (*) Number of people between ages of 15 and 64. 16 Source: United Nations.
Total Dependency Ratio (*) 100 Western Europe Europe 90 Northern Europe 80 70 Turkey 60 50 40 2011 2015 2020 2025 2030 2035 2040 2045 2050 (*) [Age 0-14 + Age 65+ ]/ Age 15-64 17 Source: United Nations.
20,000,000 21,000,000 22,000,000 23,000,000 24,000,000 25,000,000 Source: TURKSTAT. Jan-2008 Mar-2008 May-2008 Jul-2008 Sep-2008 Nov-2008 Employment Growth Jan-2009 Mar-2009 (seasonally adjusted) May-2009 Total Employment Jul-2009 Sep-2009 Nov-2009 Jan-2010 Mar-2010 May-2010 Jul-2010 Sep-2010 Nov-2010 Jan-2011 Mar-2011 May-2011 Jul-2011 Sep-2011 Nov-2011 Jan-2012 Mar-2012 May-2012 18
Average Employment Increase (**) (percentage, 2008-2011) 5 5 4 4 3 3 2 2 1 1 0 0 -1 -1 -2 -2 -3 -3 -4 -4 -5 -5 Ireland Spain* Greece* Portugal Japan US Italy* Czech R.* UK France Austria Sweden Canada Germany Korea* Taiwan* Switzerland Australia Israel* Turkey (*) IMF estimate (**) Logarithmic differences. 19 Source: IMF, TURKSTAT, CBRT.
Change in the Unemployment Rate (between 2012 Q1 and 2008 Q4, percentage points) Turkey Spain -4 -2 0 2 4 6 8 10 12 20 Source: International Labor Organization (ILO).
Source: EUROSTAT. (***) May2012 (**) March 2012 (*) Seasonally Adjusted, June 2012 10 20 30 40 50 60 0 Greece Spain Croatia Portugal Slovakia Youth Unemployment Rate (*) Italy Ireland Bulgaria Latvia Hungary Lithuania Southern Cyprus (ages 15-24, %) Poland Romania** France Estonia Sweden UK*** Luxembourg Euro Area (average): %22.5 Czech Rep. Belgium Finland Slovenia USA 15.8 Turkey*** Denmark Malta Netherlands Austria Norway Germany 21
Income Distribution Improved P90/P10 (*) 19 18.3 18 17 16 Trendline 15 14.7 14.4 13.7 14 13.1 13.0 11.9 13 12.2 12.0 11.7 12 11 10 9 2002 2003 2004 2005 2006 2007 2008 2009 2010 2011 (*) The ratio of the average household disposable income in the highest 10% income quintile to average household disposable income in the lowest 10% income quintile. 22 Source: TURKSTAT
Income Distribution (*) (Change in the Gini Coefficient, Percentage Point Change) 6 4 2 0 -2 -4 -6 -8 -10 Mexico Turkey Greece Hungary Italy New Zealand Japan Norway USA Australia Luxemburg Germany İ srael Chile Netherlands Czech Rep. OECD-20 UK France Finland Denmark Canada Sweden (*) Difference between the late 2000s and mid-90s 23 Source: OECD “Divided We Stand: Why Inequality Keeps Rising”.
Increase in Households’ Income (2011-2002, Real, %) 70 Lowest Income Quintile 60.5 60 50 43.2 40 36.8 36.0 Highest Income Quintile 34.8 34.2 29.7 30 27.4 21.2 20 10 5.2 0 1 2 3 4 5 6 7 8 9 10 Income Quintiles 24 Source: TURKSTAT.
Reduced Poverty (1) Daily Income Below 1$ (*) (% of Total Population) 0.25 0.2 0.2 0.15 0.1 0.05 0.02 0.01 0.01 0 0 0 0 0 0 2002 2003 2004 2005 2006 2007 2008 2009 2010 (*) Purchasing Power Parity Adjusted US Dollars 25 Source: TURKSTAT.
Reduced Poverty (2) Daily Income Below 2.15 $ (*) (% of Total Population) 3.5 3.04 3 2.49 2.39 2.5 2 1.55 1.41 1.5 1 0.52 0.47 0.5 0.22 0.21 0 2002 2003 2004 2005 2006 2007 2008 2009 2010 (*) Purchasing Power Parity Adjusted US Dollars 26 Source: TURKSTAT.
Reduced Poverty (3) Daily Income Below 4.30 $ (*) (% of Total Population) 35 30.3 30 25 23.75 20.89 20 16.36 15 13.33 10 8.41 6.83 3.66 4.35 5 0 2002 2003 2004 2005 2006 2007 2008 2009 2010 (*) Purchasing Power Parity Adjusted US Dollars 27 Source: TURKSTAT.
-50 -40 -30 -20 -10 10 20 30 40 50 0 Source: OECD Turkey Italy Hungary Israel Switzerland New Zealand Sweden Official Development Aid Slovak Rep. (2011, year-on-year change, percent) Germany Korea Australia Poland Czech Rep. Slovenia UK USA Denmark Portgugal Ireland Finland Canada Luxembourg France Netherlands Norway Japan Belgium Austria İ celand Spain 28 Greece
Commitment to Fiscal Discipline Central Government Budget Deficit (percent of GDP) 14 11.5 12 10 8.8 8 6 5.5 5.2 3.6 4 1.8 1.6 2 1.3 1.1 0.6 0 2002 2003 2004 2005 2006 2007 2008 2009 2010 2011 29 Source: Undersecretariat of Treasury.
Commitment to Fiscal Discipline EU Defined Debt Stock (percent of GDP) 80 74.0 67.7 70 59.6 60 52.7 50 46.5 46.1 42.4 39.9 40.0 39.4 40 30 20 2002 2003 2004 2005 2006 2007 2008 2009 2010 2011 Source: Undersecretariat of Treasury. 30
Banking Sector: Capital Adequacy Ratio (2011) 20 Basel II Level 18 16 14 12 10 8 6 4 2 0 Italy Turkey India Germany Spain US UK Brazil Greece S.Korea 31 Source: IMF, BRSA.
Household Liabilities (percent of GDP, 2012 Q1) Turkey 19.4 Lithuania Slovak ¡Rep. Bulgaria* Slovenia Czech ¡Rep. Poland Hungary ¡ Latvia ¡ Italy ¡ Estonia Belgium Austria ¡ France Germany ¡ Greece ¡ ¡ ¡ Finland Spain Sweden Portugal UK Ireland Netherlands Denmark 0 20 40 60 80 100 120 140 160 32 Source: ECB, CBRT.
Banking Sector: Non-Performing Loan Ratio (percent) 6 5.3 5 4.7 4 3.7 3.7 3.7 3.5 3 2.8 2.7 2 1 0 2005 2006 2007 2008 2009 2010 2011 Aug-12 33 Source: BRSA.
Inflation Rate 34 Source: CBRT.
Recommend


More recommend
Explore More Topics
Stay informed with curated content and fresh updates.