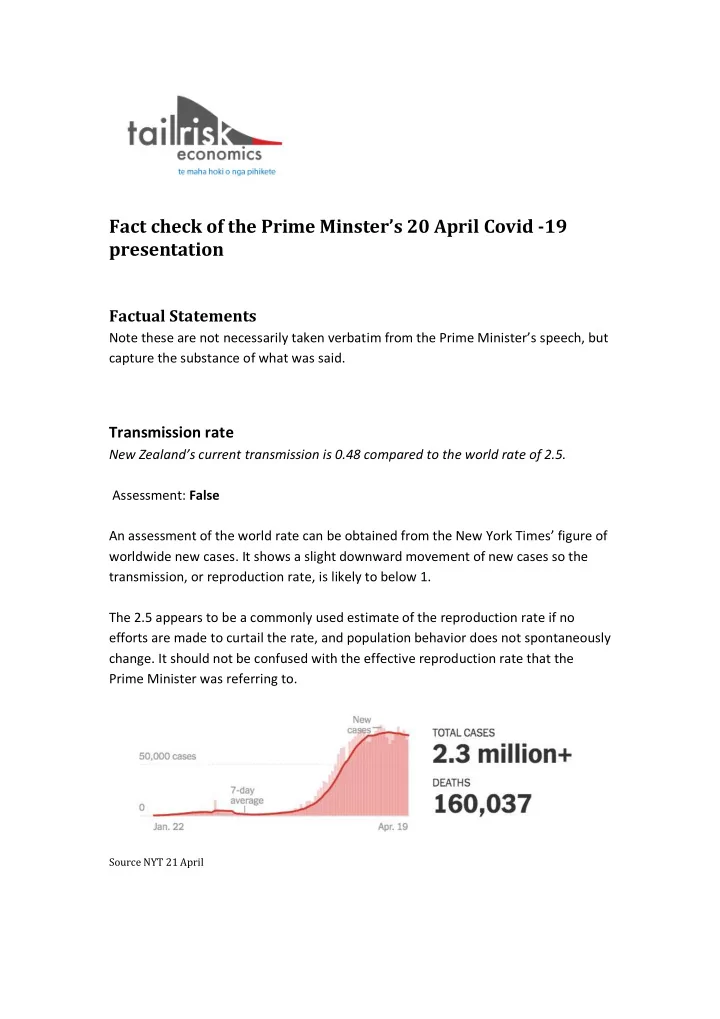

Fact check of the Prime Minster ’ s 20 April Covid -19 presentation Factual Statements Note these are not necessarily taken verbatim from the Prime Minister’s speech, but capture the substance of what was said. Transmission rate New Zealand’s current transmission is 0.48 compared to the world rate of 2.5. Assessment: False An assessment of the world rate can be obtained from the New York Times’ figure of worldwide new cases. It shows a slight downward movement of new cases so the transmission, or reproduction rate, is likely to below 1. The 2.5 appears to be a commonly used estimate of the reproduction rate if no efforts are made to curtail the rate, and population behavior does not spontaneously change. It should not be confused with the effective reproduction rate that the Prime Minister was referring to. Source NYT 21 April
Number of cases per 10,000 New Zealand has one of the lowest number of cases per 100,000 of population Assessment: False Worldometer, a commonly used source for tracking coronavirus outcomes, presents data on the number of cases per million of population for 210 states and territories. On 20 April 2020 135 had a lower rate than New Zealand. Number of deaths We may be one of a small number of countries where the numbers are small Assessment: False Worldometer (21 April) reports 119 states and territories that had 12 or fewer deaths. Containing the pandemic We have done what very few countries have managed to do; we have stopped a wave of devastation Assessment: False Assessing what constitutes stopping a ‘ wave of devastation’ is open to interpretation. A large number of countries have not had a ‘wave of devastation’, and have bought the virus under control with a transmission rate of less than 1, so devastation is unlikely. A ‘wave of devastation’ co uld be defined as a per capita number of deaths that is a multiple of the season flu. In New Zealand the MOH reports that there are an average of 500 influenza deaths a year, a death rate of 100 per million. Assuming five times tha t rate is a ‘wave of devastation’, the required death rate per million is 500. At present 17 countries report a death rate of over 100 and most have a transmission rate below one. A handful of more advanced countries have already passed 500, or are likely to do so, projecting forward their case numbers. It is difficult to forecast what will play out in the developing world.
Mortality rates New Zealand has one of the lowest mortality rates in the world (according to the Oxford University Response Tracker) Assessment: False . The Oxford University Response Tracker reports an index of government actions to control the coronavirus. There does not appear to be any country information on mortality rates on the site. There is a tracker that compares case numbers with the stringency level by country. Worldometer data (20 April 2020) shows that New Zealand had the 94 th lowest mortality rate of reported countries and territories. Some of the countries are at an earlier stage in the pandemic, and their mortality rate will rise in the future. But on the current facts the statement is clearly false. Testing rate s New Zealand has one of the highest testing rates in the world Assessment: False New Zealand ranked 28 th on the Worldometer (21 April 2020) measure of cumulative tests per million of population. Contact: Ian Harrison, Principal Tailrisk economics e-mail harrisonian52@gmail.com Ph. 022-1753669
Recommend
More recommend