
Equipment Selection
Purchasing Equipment • What model do I choose? • See “Buyer’s Guide” on electrofishing.net for a list of criteria. • The most involved part, and often one of the most important considerations, is estimating the water conductivity range that can be effectively sampled (Power Analysis)
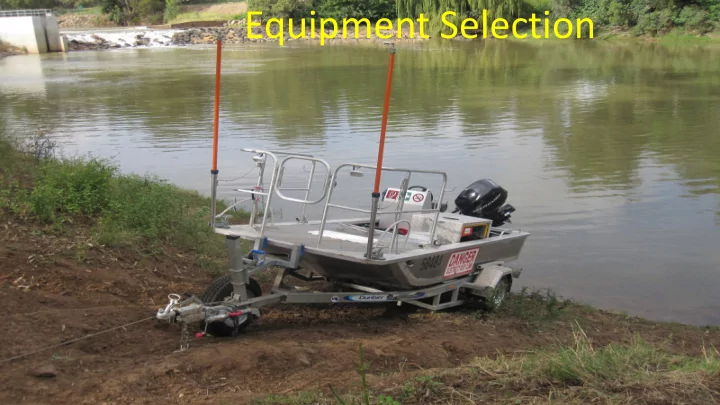
Choosing a control box: Power Analysis You have a boat electrofisher with 2 booms, each having a 28 cm diameter sphere, and the hull is wired as the cathode. The total electrode resistance is 45 Ohms at 100 µS/cm. The generator size is 7.5 kilowatts. There are two models to choose from: Control box “A”: 6500 W, 1100V/10A, 600V/20A, 300V/35A Control box “B”: 5600 W, 600V/45A, 300V/72A You have three situations to analyze separately. Your sample sites have water conductivity in the range of: A. 20 – 50 µS/cm B. 150 – 500 µS/cm C. 700 – 1,200 µS/cm For your sampling program, you have found that a PDC waveform of 60 pps, 20% duty cycle, 3,000 W peak is needed for successful electrofishing at matched conditions (115 µS/cm).
Choosing a control box: Power Analysis • This is a composite graph with control box “A” output represented by the black line and control box “B; output at the open symbols.
Choosing a control box: Power Analysis The approach used here is the same- follow the output line down to the power goal curve. Conductivity range results are: Control box “A”: 21 – 750 µS/cm Control box “B”: 46 – 1607 µS/cm
Choosing a control box: Power Analysis Thus, the choices are: A. Control box “A” (low conductivity) B. Either control box “A” or “B”, although control box “B” has more excess power that might be useful (intermediate conductivity) C. Control box “B” (high conductivity)
Backpack Electrofishers • Use the same process but at a different scale • Software is Backpack Power Excel file. • Some results from – Dean, J.C., Temple, A.J. and Smith, J.W. 2019. Output Performance of U.S.‐Built Backpack Electrofishers. NA Journal of Fisheries Management 39(6): 1321‐1328.
Results Determine effective conductivity ranges and compare to published technical specifications 25% Duty Cycle Maximum Output of Peak Power for Backpack Electrofishers 10,000 MLES Xstream S-R LR24 Peak Power (Watts) ETS ABP-3 1,000 S-R Model 12 Xstream: Not given 100 LR-24: 10 – 2150 µS/cm 10 100 1,000 10,000 Ambient Conductivity ( µ S/cm) ABP-3: 25 – 1400 µS/cm Blue curve: power needed for successful EF, based on 300 W threshold at 115 µS/cm, using a PDC, 60 pps, 20 – 25% duty cycle, Model 12: 10 – 1,600 µS/cm in mid-sized streams
Backpack Power Analysis • Bring up Backpack Power • Estimate the effective conductivity range of a hypothetical backpack with these specifications and criteria: maximums: 400W output power, 900 V, 10 A waveform: 60 pps, 25% duty cycle electrode resistance at 100 µS/cm: 285 Ohms threshold data: minimum 282 Watts needed for successful electrofishing in mid‐sized stream at a ambient conductivity of 232 µS/cm
Recommend
More recommend