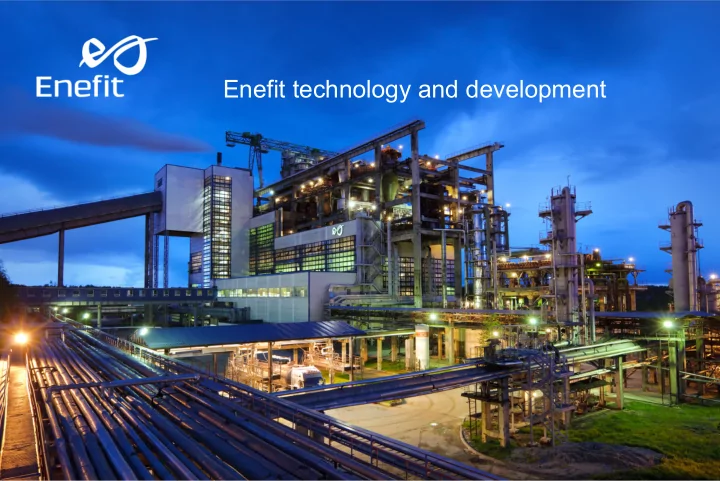

Enefit technology and development
DEVELOPING AN IMPROVED SOLID HEAT CARRIER PROCESS – ENEFIT 280 Indrek Aarna, Andreas Orth Enefit Outotec Technology Agnes von Garnier, Peter Weber Outotec October 18-20, 2010 30th Oil Shale Symposium Golden, CO
Contents § From Enefit 140 to Enefit 280 § Project schedule and status § Test work performed § Direct drying tests § Combustion of spent shale § Computational analysis § SolidSim – a new tool for particle class balance § CFD analysis of Waste Heat Recovery Unit § Dynamic modeling § Enefit test and pilot plant § Conclusions
Improvements to Enefit 140 Process - Lower air emissions Environment - Lower organic carbon content in ash (processed shale) - Lower water consumption - Increased thermal efficiency of the process Efficiency - Increased availability of the plant - Lower dust content of shale oil (< 0.15 %) Product Quality - Lower specific gravity of oil (< 1.0 kg/l) - Double existing unit capacity of 140 t/h oil shale throughput Capacity Enefit 280
Project schedule July, 10, 2009 u Contract to built 1.5 Mbbl/a shale oil plant in Narva signed u Joint Venture Enefit Outotec Technology founded May, 3rd, 2010 u “ breaking ground ” event June 2010 u Piling completed u Commencement of civil works October 2010 u Commencement of mechanical erection with oversize retort lift 1st Quarter 2012 u Start of hot commissioning
Narva plant site, October 2010
Oil shale test work: Analytical data Properties Proximate Analysis • Heating value: 8.4 MJ/kg w 42 - 50% • Mineral content: • Density: 1000 kg/m 3 9 - 12% • Moisture: • Oil yield in ENEFIT 280:15.1% d.b. 25 - 30% • Organic content: Analysis (dry basis) Ash analysis • Ash: 52.2% 51.8% • CaO: • C tot : 25.4% 22.8% • SiO 2 : • H: 2.31% 6.5% • MgO: • S: 0.39% 5.6% • Al 2 O 3 : • N: 0.12% 2.9% • Fe: • C mineral : 6.7% 2.0% • K: Fischer assay • TOC: 18.7% 16.1 % • Oil: 5.8 % • Gas: 2.5 % • Water: 75.6 % • Semi coke:
Aspen+ model: using the analytical data Analytical data Enefit 140 Fischer Assay Gas composition Gas yield Oil yield Oil composition Oil shale CONDENSATION Proximate + ultimate Water analysis, Vapor-gas Flue gas mineral mixture composition Semicoke composition RETORT CFB Semicoke yield Ash Mineral composition
Aspen+ model: Heat and mass balance (Estonian example) ENEFIT 280 Energy balance (specific) 6.64 t OS (wet) 1 t Shale Oil 17.5 MWh 11.4 MWh Oil winning 0.34 t Retort Gas 3.2 MWh 0.3 MWh El. Energy 0.9 MWh el. Energy Losses 2.4 MWh Efficiencies Specific oil yield 0.151 t Oil / t Oilshale dry Total energy efficiency 0.87 Total efficiency related to oil 0.64
700mm CFB pilot plant (at Outotec R&D Center, Frankfurt)
700mm CFB pilot plant (at Outotec R&D Center, Frankfurt) Modifications for drying tests
Direct drying of oil shale (700mm CFB pilot plant) PHASE III: oil shale feed < 6,3mm, 2. Day / With widening [DN100->DN125] Combined PSD (Cyclone II Discharge + Dust Loss) Phase III: oil shale feed < 6.3 mm 55 50 PSD cyclone II discharge 45 OS 45/09<6,3mm 55 Cyc 2 Discharge Test 6 40 OS 45/09<6,3mm Cyc 2 Discharge Test 7 35 Cyc 2 Discharge Test 6 50 fraction [%] Cyc 2 Discharge Test 8 30 Cyc 2 Discharge Test 7 45 25 Cyc 2 Discharge Test 8 20 40 15 35 10 fraction [%] 5 30 0 0 - 100 100 - 200 200 - 315 315 - 500 500 - 1000 1000 - 2000 2000 - 4000 > 4000 25 grain size [ µ m] 20 15 10 5 0 0 - 100 100 - 200 200 - 315 315 - 500 500 - 1000 1000 - 2000 2000 - 4000 > 4000 grain size [ µ m]
SolidSim – a new tool for particle class balance First design WHB Steam Gas to Ash Condensation Scrubber 1.7 t/h ESP Ash CFB 36 t/h Air Slide Venturi Secondary Air Oil Shale Dust Chamber Retort WHB Cyclone Primary Air Ash Ash Cooler
SolidSim – a new tool for particle class balance Improved design WHB Steam Gas to Ash Condensation Scrubber 0.6 t/h ESP Ash CFB 11 t/h Air Slide Venturi Secondary Air Oil Shale Dust Chamber Retort WHB Cyclone Primary Air Ash Ash Cooler
Combustion of spent shale (700mm CFB pilot plant) 800 20.0 18.0 700 feed and discharge rate [kg/h] / 16.0 600 CO 2 -offgas [%, d.b.] 14.0 Temperature [°C] 500 12.0 400 10.0 8.0 300 6.0 200 4.0 Test 3 Test 4 Test 5 Test 1 Test 2 100 2.0 0 0.0 29.09. 30.09. 30.09. 30.09. 30.09. 30.09. 30.09. 30.09. 30.09. 30.09. 30.09. 30.09. 30.09. 01.10. 22:00 00:00 02:00 04:00 06:00 08:00 10:00 12:00 14:00 16:00 18:00 20:00 22:00 00:00 date / time Semi Coke Feed [kg/h] bottom ash discharge [kg/h] T225 CFB bottom [°C] CO2 [%]
Environmental: Emissions optimized and proven • SO 2 < 50 mg/m 3 (stp) – Excess of limestone absorbs sulphuric oxides • PM < 25 mg/m 3 (stp) – ESP with 5 fields guarantees low dust emissions • NO x < 200 mg/m 3 (stp) – Air staging in CFB prevents high temperature zones for thermal NO x generation • TOC (ash) ~ 0 – CFB has excellent heat and mass transfer conditions and provides enough retention time
CFD analysis - waste heat recovery unit Original design inlet outlet superheater baffles
CFD analysis - waste heat recovery unit Weak points m/s 1. inhomogeneous flow in vertical channel 2. vortex zone 3. dead zone between inlet channels bypass current
CFD analysis - waste heat recovery unit Improved design displayed cross sections m/s
Dynamic modeling Objectives: § Test plant behaviour before commissioning § Check for possible pitfalls in plant behaviour § Gain more reliability of the newly designed Enefit process § Reduce commissioning time
Recommend
More recommend