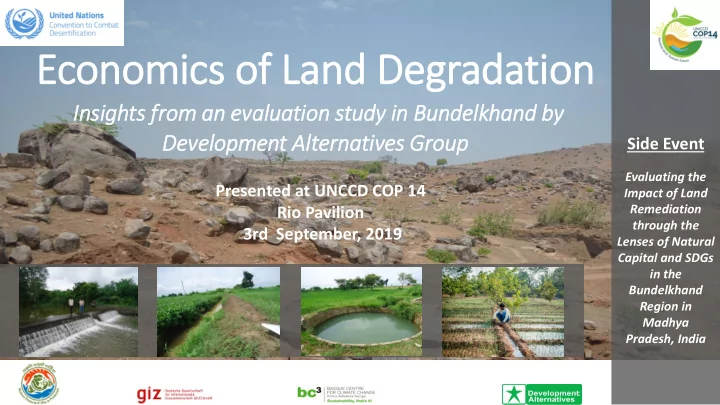
Economics of Land Degradation Insights fro In rom an evaluation study in in Bundelkhand by Development Alt lternatives Gro roup Side Event Evaluating the Presented at UNCCD COP 14 Impact of Land Remediation Rio Pavilion through the 3rd September, 2019 Lenses of Natural Capital and SDGs in the Bundelkhand Region in Madhya Pradesh, India
Content • Land Degradation – Current scenario in India • Bundelkhand – A Brief Profile • Introduction to Project- ELD • ELD Methodology Adapted to Local Context • Insights from Field : TBL impact of Land Management. • Initial Evaluation Findings • Opportunities for India • Emerging Questions
The India Context : Land Degradation and Livelihood Dependence on Land • India, with 2.4% of the world’s land but 17% of its population has very low per capita availability of land (SoER, 2015) • 97 mn (i.e. 29%) hectares of land is under degradation and of this 83 Mha is undergoing desertification (SoER, 2015) • Major causes of degradation are water erosion (36 Mha) and wind erosion (18 Mha) (SoER, 2015) • 67% of net sown area is rain-fed and therefore completely dependent on ecosystems for water access (CRIDA) • India is losing Rs. 28,500 crore, on account of degraded lands equal to 12% of total value productivity of these lands (Ankita Rai, 2015)
The Bundelkhand Context Environmental Social Economic • Reduced precipitation rate • Seasonal migration rate in • Per capita income is 50- by 32% between 2013- Bundelkhand is 39.4% 55% lower than the 2018 (IMD) national average • Aggregated HDI rank at • 33% of the cropped area • 67% population is in 0.594 is amongst the receives less than 750 mm lowest in the country agriculture and 77% of rainfall (India average is 0.663) those are small and marginal farmers • 22 % of total area under • Average literacy rate 66 % , forests mainly shrub and • Small and fragmented lower than the state heavily encroached average of MP and UP size land holdings which is 69% • Shift in monsoon period by • Per capita food 55-60 days, from mid-June • 48 % of population below availability is only 330kg to mid-August poverty line per annum • 70% of tanks, ponds and • 26% of population belong reservoirs are dry due to to lower social class fall in surface and groundwater
Development Alternative's Work on Natural Resource Management in Bundelkhand Climate Adaptive Reviving Natural Watershed Development Sustainable Agriculture Planning Ecosystems • Soil water conservation • Crop diversification and • Awareness generation • Ecological rejuvenation in • Participatory net • Climate adaptive integrated farming arid and semi arid region • Climate resilient agri- planning decentralized planning • Afforestation • GIS based planning practice • Water use efficiency • Organic farming • Farmer producer Org. Research & Policy Influence Training & Capacity Building Outreach & Awareness Creation through Rural Communication Channels
Insight from Field : Triple Bottom-Line Impact of Land Management investment Integrated Natural Resource Management reduced participatory social in health, management migration cohesion education Social Wellbeing aquifer reduced improved TBL Ecological recharge, pollination Improved Natural Capital degradation, biodiversity, Impact soil OC, services Security erosion biomass moisture Economic Development improved drought improved Improved crop yield, resilience income agri-practice fodder
Introduction to the Current Study • We present an ‘ economic ’ approach that values natural resources under different management regimes to combat desertification. Valuing • Using the value of ecosystem services, the augmented land as a value of our natural capital is estimated as a function of function of how it how the ecosystems are used and managed. is used • Increases in the value of services of land through remediation are compared with the costs of remediation.
Introduction to the Current Study To evaluate the potential of land remediation activities as beneficial and cost effective measures for combating desertification To develop a toolkit for assessment of similar land remediation programmes Geographical Coverage under similar 3 districts : Datia, Shivpuri, Niwari environmental and socio- economic conditions Comparison Period 2013 and 2018 To evaluate changes in SDG Partners: indicator values for a reduction in land degradation.
ELD Research Methodology Adapted to Local Context Habitat Quality Primary and Crop Pollination secondary SDGs Carbon storage and Carbon storage and data collection Mapping Sequestration Sequestration Forest Carbon Edge Effects Annual Water Yield Social Perceptions capital Nutrient Delivery Ratio Mapping assessment Sediment Delivery Ratio Seasonal Water Yield Crop Production Crop Production GIS based mapping InVEST GLOBIO Economic Visitation: Recreation and valuation Tourism Software based Social Capital analysis Geographical Types of Ecosystem Identifying Cost benefit Inception categorizatio Ecosystem services and Patterns and analysis and Take action n Services economics Pressures others
Initial Evaluation Findings – Land Use Changes from 2013 to 2018 – In Intervention Cluster 2013 2018 Zooming In
Initial Evaluation Findings – Land Use Changes from 2013 to 2018 – In Intervention Cluster 2013 2018 Conversion of single cropped land to double cropped land Increase in on-farm habitation
Initial Evaluation Findings – Relative Change in Land Use from 2013 to 2018 – In Intervention & Control Cluster Intervention • Increase in area under 2018 2013 double cropping by 3 times in the beneficiary village • All the single crop area during rabi season (Oct- Feb) got converted to double cropping, farmers have started cultivating Control Khariff season crops like paddy, groundnut and Black gram • Increase in double crop area in control villages also, but not as much as in intervention villages
Initial Evaluation Findings-Crop Production TOTAL PRODUCTION ( In quintals) CROP AREA ( In ha) 3000 90000 80000 2500 70000 2000 60000 50000 1500 40000 1000 30000 500 20000 10000 0 0 2013 2019 2013 2019 Intervention Villages Control Villages Intervention Villages Control Villages PRODUCTIVITY (Quintals/ha ) VALUE PER HA (INR) 30 17.7 53939 30812 7.4 6.4 11692 10332 2013 2019 2013 2019 Intervention Villages Control Villages Intervention Villages Control villages
Benefits from land remediation Rs. Lakh If Sustained If Limited Benefits from land Remediation ( For 30 years) (For 10 years) Crop Production 10,033 6,020 Carbon Sequestered 332 199 Total 10,364 6,219 Costs of Remediation (Project costs) 450 450 Benefit-Cost Ratio* 23.0 13.8 *Benefits are present values at 4% discount rate
Inference from the study- further opportunity • The initial results show that the benefits received from the land remediation activities (natural capital) are much greater than the costs and are unparalleled in terms of economic value • The study can provide scientific evidence for policy recommendation of where to invest in remediation and how much to invest • It can contribute to India’s commitment of achieving the LDN targets of halting any further land degradation and rehabilitation of at least 30 m ha degraded wasteland, forest and agricultural land •
Key Emerging Questions • Can this methodology play an important role in restoring the land degradation and achieving the LDN target ? • Can this contribute to the decision making and incentivize investments in land restoration? • Can this influence biodiversity conservation and better management of ecosystem services
THANK YOU
Recommend
More recommend
Unleash a World of Digital Possibilities—Browse, Share, and Explore Content Without Boundaries