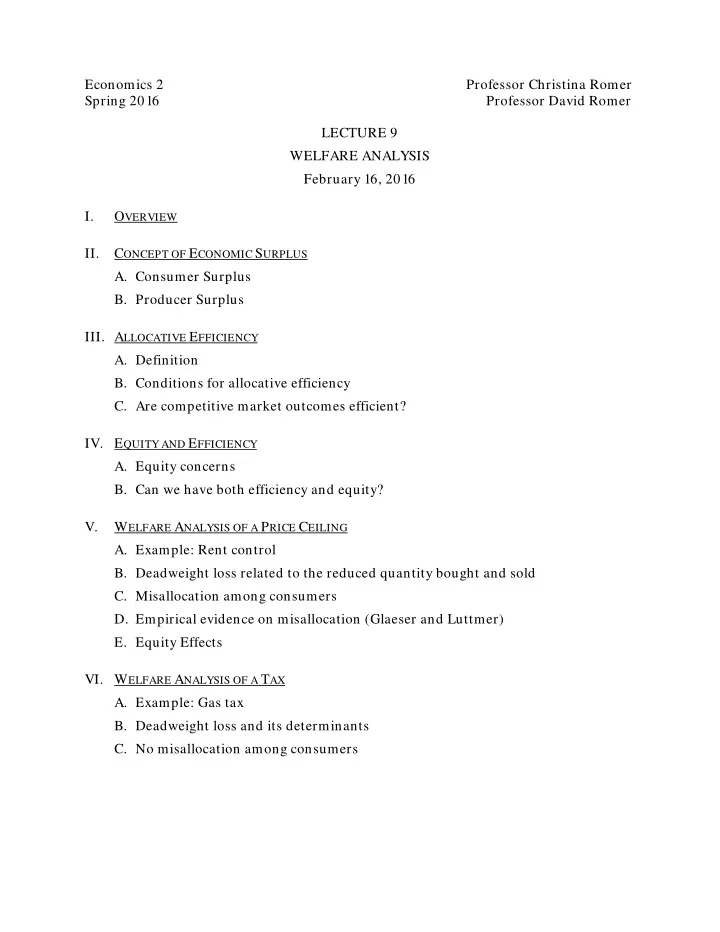

Economics 2 Professor Christina Romer Spring 2016 Professor David Romer LECTURE 9 WELFARE ANALYSIS February 16, 2016 I. O VERVIEW II. C ONCEPT OF E CONOMIC S URPLUS A. Consumer Surplus B. Producer Surplus III. A LLOCATIVE E FFICIENCY A. Definition B. Conditions for allocative efficiency C. Are competitive market outcomes efficient? IV. E QUITY AND E FFICIENCY A. Equity concerns B. Can we have both efficiency and equity? V. W ELFARE A NALYSIS OF A P RICE C EILING A. Example: Rent control B. Deadweight loss related to the reduced quantity bought and sold C. Misallocation among consumers D. Empirical evidence on misallocation (Glaeser and Luttmer) E. Equity Effects VI. W ELFARE A NALYSIS OF A T AX A. Example: Gas tax B. Deadweight loss and its determinants C. No misallocation among consumers
Economics 2 Christina Romer Spring 2016 David Romer L ECTURE 9 Welfare Analysis February 16, 2016
Announcements • Midterm 1 Logistics: • Tuesday, February 23 rd , 3:30–5:00 • Sections 102, 104, 107, 108 (GSIs Pablo Muñoz and David Green) go to 245 Li Ka Shing Center (corner of Oxford and Berkeley Way). • Everyone else come to usual room (2050 VLSB). • You do not need a blue book; just a pen.
Announcements (continued) • Midterm 1 Format: • Sample midterm. • Problems; true/false/uncertain questions; multiple choice. • Midterm Coverage: • Everything up through lecture on Thursday, February 18. • Lecture, section, textbook, and additional readings.
Announcements (continued) • Hints for Studying: • Start now! • Review lecture notes and slides; study problem set suggested answers. • Pose yourself problems. • Places to Get Help: • Professor and GSI office hours. • Review session on Friday, February 19, 4:30–6:00 p.m. in 155 Dwinelle.
I. O VERVIEW
II. C ONCEPT OF E CONOMIC S URPLUS
Economic Surplus • A measure of the amount by which buyers and sellers benefit from participating in the market. • The total economic surplus is the sum of: • Consumer surplus • Producer surplus • Government revenue (if relevant)
Demand Individual Consumer Market P P q Q
Marginal Benefit (or Reservation Price) • The dollar value to consumers of another unit of a good. • What they would be willing to pay for one more unit.
Consumer Surplus P S 1 P 1 D 1 ,MB Q 1 Q
Supply Market Typical Firm P P Q q
Producer Surplus P S 1 ,MC P 1 D 1 ,MB Q 1 Q
III. A LLOCATIVE E FFICIENCY
Total Surplus = Consumer Surplus + Producer Surplus P S 1 ,MC P 1 D 1 ,MB Q 1 Q
Allocative Efficiency (Also Called Pareto Efficiency) • The total surplus is as large as possible.
Conditions for Allocative Efficiency • The good is produced up to the point where MB = MC. • The good is allocated to the consumers with the highest MB. • The good is produced by the producers with the lowest MC.
Allocative Efficiency of the Competitive Market Outcome P S 1 ,MC P 1 D 1 ,MB Q 1 Q
IV. E QUITY AND E FFICIENCY
Equity Issues • Willingness to pay (which underlies consumer surplus) depends in part on income. • Economists’ measure of welfare doesn’t take into account that consumers may enter the market with vastly different incomes.
Equity and Efficiency • Allocative efficiency is still a worthy goal. • Interfering with the price system to improve equity may be costly. (And may not improve equity much.) • There are ways to improve equity without sacrificing what is good about the price system.
V. W ELFARE A NALYSIS OF A P RICE C EILING
Effects of a Price Ceiling P S 1 P 1 D 1 Q 1 Q
Welfare Analysis of a Price Ceiling P S 1 a b P 1 d c P C e D 1 Q S Q 1 Q Free Market (Q 1 ) Price Ceiling (Q S ) Consumer Surplus a+b a+c Producer Surplus c+d+e e Total Surplus a+b+c+d+e a+c+e Deadweight Loss b+d (+ misallocation)
Deadweight Loss • Any shortfall in total surplus from its maximum level. • The deadweight loss of a price ceiling is surely larger than b+d because there is misallocation among consumers . • Consumer surplus is, in fact, less than a+c because the good is allocated in some way other than by price.
Glaeser and Luttmer “The Misallocation of Housing under Rent Control” • Look at the overlap percentage: The fraction of time a member of the group we expect to consume fewer rooms actually consumes more than a member of the group we expect to consume more. • Empirical strategy: Compare allocation of housing in a city with rent control (NYC) with allocation in a number of cities without rent control.
Glaeser and Luttmer The Misallocation of Housing under Rent Control Source: Glaeser and Luttmer, “The Misallocation of Housing under Rent Control.”
Effect of a Tax S 2 P S 1 tax P 2 P 1 P 2 −tax D 1 Q 2 Q 1 Q
Welfare Analysis of a Tax (Version 1) S 2 P S 1 tax a P 2 b c d P 1 f g e P 2 −tax h i D 1 Q 2 Q 1 Q Free Market (Q 1 ) Tax (Q 2 ) Consumer Surplus a+b+c+d a Producer Surplus e+f+g+h+i h+i Government Revenue b+c+e+f Total Surplus a+b+c+d+e+f+g+h+i a+b+c+e+f+h+i Deadweight Loss d+g
Welfare Analysis of a Tax (Version 2) S 2 P S 1 tax a P 2 b c d P 1 g e f D 1 Q 2 Q 1 Q Free Market (Q 1 ) Tax (Q 2 ) Consumer Surplus a+b+c+d a Producer Surplus e+f+g b+e Government Revenue c+f Total Surplus a+b+c+d+e+f+g a+b+c+e+f Deadweight Loss d+g
Recommend
More recommend