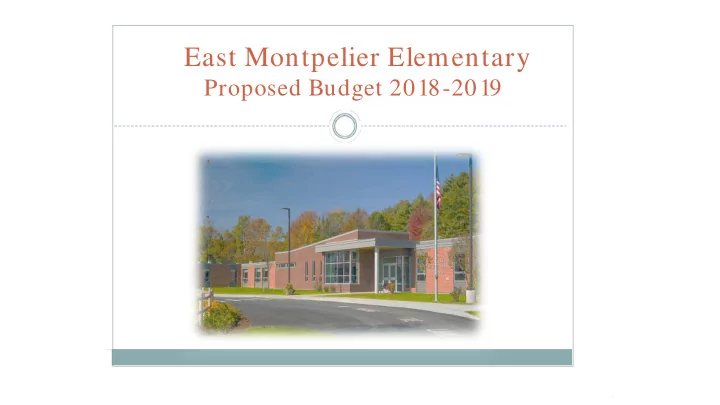

East Montpelier Elementary Proposed Budget 2018-2019
Welcome • Budgeting Process • Components of the 2018-2019 Budget • Tax Impacts Local Budgets State T ax Rate Property Yield Common Level of Appraisal
Competing Pressures
Developing our Budget Principal, Superintendent & Business Administrator (with Staff Input) 3 budget Budget Draft drafts Scenarios School Board Review & 2 Community Forums Board Approval V oter Approval
The Proposed Budget • $ 3,990,773 • Expense Change 4.72% • Net Impact on Taxes 3.63% • Proposed budget education spending per equalized pupil: • $19,645 FY18-19 • $19,438 FY17-18 • Equalized spending change is 1.06% higher than the current year.
East Montpelier Elementary School Expense Budget-Percentage of Each Category To The Total Budget Expense Budget FY1819 $3,990,773 Debt Service/Capital, $667,857, 17% Salaries & Benefits, $2,335,320, 58% Non Salary, $987,596, 25%
East Montpelier Elementary School Percentage of Each Expense Category To The Total Budget Capital Fund FY17-18 FY18-19 Student Capital Fund Student Transfer, Transportation, Transfer, Transportation, $71,522, 2% $131,705, 3% $71,522, 2% $99,818, 3% Debt Service, Debt Service, $608,753, 16% $596,335, 15% Direct Direct Food Program Instruction, Food Program Instruction, Support, $1,593,718, Support, $1,581,058, $10,000, 0% 40% $10,000, 0% 41% Operation of Operation of Plant, Plant, $302,485, 8% $305,802, 8% WCSU WCSU Assessments, Assessments, $495,416, 12% $420,479, 11% Support Special Support Special Administrative, Administrative, Programs, Education, Programs, Education, $287,235, 7% $282,969, 7% $326,116, 9% $100,159, 3% $318,567, 8% $188,056, 5% NOTE: The WCSU Assessments include Special Education & Student Transportation for the schools.
Budget Change Highlights • Negotiated Items • Salary Increases $ 50,945 • Benefit Changes -$ 3,786 • Staffing Changes $ 59,639 • Total $106,798 (2.80% of Budget) • Non-Salary Items $ 73,033 (1.92% of Budget) • Combined Total $179,831 (4.72% of Budget) • Revenues $ 41,503 ( 1.09% of Budget) • Net Impact on Taxes $138,328 (3.63% of Budget)
East Montpelier Elementary Student Enrollment 2016-2017 School Year Prek-6 enrollment was 210 • 2017-2018 School Year Prek-6 enrollment is 229 • According to NESDEC, our PreK-12 enrollment is projected to be • level over the next 5 years.
Education Spending Per Equalized Pupil Education Spending Per SCHOOL Equalized Pupil BERLIN $16,892 CALAIS $15,912 EAST MONTPELIER $19,645 MIDDLESEX/RUMNEY $19,287 WORCESTER/DOTY $17,255 U-32 $18,056
Percentage of Expense Change for Proposed Budgets & Net Tax Impact Net Impact On Taxes By % of Expense Change Town SCHOOL Proposed Budget 11.0 Cents BERLIN 1.74% 6.8 Cents CALAIS -3.82% 9.4 Cents EAST MONTPELIER 4.72% 3.9 Cents MIDDLESEX/RUMNEY 3.40% 16.3 Cents WORCESTER/DOTY 2.67% Included Above U-32 3.69% Included Above WCSU* See Note 5.47% * Note: This includes 3.28% for Special Education and Transportation for Schools.
Tax Impact Four factors affect the local tax rate: The Common Level of Appraisal (CLA) The Statewide Education Tax Rate The Property Yield is a new feature of the education funding system. The East Montpelier Elementary and U-32 budgets* * We only have control over the 4 th item.
Common Level of Appraisal(CLA) The CLA is an adjustment to the education tax rate to account for the gap between appraised value and actual value of property. • The 2018-2019 CLA for East Montpelier is 95.83% (.89% change from last year’s 94.94% rate) This results in a tax decrease of $1.8 cents.
Statewide Tax Rate (As of January 24,2018) The Residential Tax Rate is projected to stay the same at $1.00. The Property Yield represents the amount of revenue raised by $1.00 base Homestead Property Tax Rate. The Property Yield is projected to decrease by $318 (from $10,160 to $9,842) which results in a tax increase of $6.3 cents The Nonresidential Tax Rate is projected to increase $.079 from $1.55 to $1.629. This combined with the change in CLA results in a tax increase of $ 8.3 cents. NOTE: These rates do not reflect income sensitivity adjustments, which are available to most homeowners with incomes less than $137,500 per year.
Tax Rate Impacts for 2018-2019 Combined Impact on NON- Combined Impact Residential Tax on Residential Rate TOWN Tax Rate $.11 or $.14 or BERLIN $110/100,000 $140/100,000 $.068 or $.095 or CALAIS $68/100,000 $95/100,000 $.094 or $.083 or EAST MONTPELIER $94/100,000 $83/100,000 $.039 or $-.03 or MIDDLESEX/RUMNEY $39/100,000 $-30/100,000 $.163 or $.12 or WORCESTER/DOTY $163/100,000 $120/100,000 NOTE: These rates do not reflect income sensitivity adjustments, which are available to most homeowners with incomes less than $137,500 per year.
Data on Income Sensitivity 64% of East Montpelier residents receive support for their property taxes from the Income Sensitivity 36% of the East Montpelier residents pay the full tax rate
Town of East Montpelier Vermont Property Tax Adjustments* *As Processed By the Vermont Tax Department CY 2016 Residents Received Property Tax Adjustments & Rebates Totaling $1,304,749 Residential Property No Adjustment, 353, 36% School Property Tax- Income under $141k, 467, 47% Renter Rebate, 22, 2% Circuit Breaker-Income Under $47k, 153, 15%
Summary The East Montpelier Elementary School Board is proposing a 2018- 2019 budget of $3,990,773. The proposed budget is a 4.72% increase over last year’s expense budget. Passage of both the East Montpelier Elementary School and U-32 budgets will result in a 9.4 cent increase in the Local Homestead tax rate. This translates to an increase of $94 per $100,000 of assessed value. Our tax rate is projected to increase due to the change in the Common Level of Appraisal & the State-wide Education Tax Formula. We believe this is a responsible budget, balancing fiscal constraint with student needs. We ask for your support. A public hearing will be held at the East Montpelier Elementary School on Saturday March 3, 2018 at 9:30am to provide information to be voted by Australian Ballot at Town meeting.
Recommend
More recommend