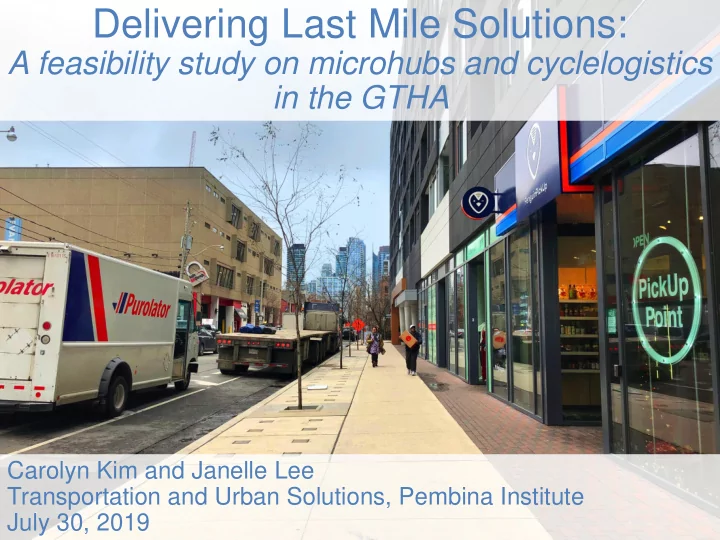

Delivering Last Mile Solutions: A feasibility study on microhubs and cyclelogistics in the GTHA Carolyn Kim and Janelle Lee Transportation and Urban Solutions, Pembina Institute 1 July 30, 2019
The Pembina Institute The Pembina Institute is a non-profit think-tank that advocates for strong, effective policies to support Canada's clean-energy transition. 2
Our freight program Support the freight industry and governments in achieving a deep decarbonization of freight while remaining profitable and building better communities 3
Thanks to our generous supporters
Presentation Outline Urban freight challenges Research objectives and approach Key findings Recommendations for action 5
Today’s presentation https://www.pembina.org/pub/delivering-last-mile-solutions 6
• E-commerce, changing consumer preferences Urban freight • Increased congestion, challenges curbside conflicts • High cost of last-mile distribution 7
Transportation Emissions GHG Emissions in Canada by Change in annual passenger and freight GHG emissions in Economic Sector (2017) Canada Source: Pembina Institute analysis of data Source: Pembina Institute analysis of data from Environment and from 2019 NIR Climate Change Canada 8
New opportunities to • Micro-consolidation improve last • mile deliveries Low- and zero-emission delivery vehicles and save money 9
Photo: Janelle Lee. Pembina Institute. 10
Photo: The Drop. Photo: Not Far From The Tree. Photo: Janelle Lee. Pembina Institute. Photo: Steve Russell. Toronto Star. 11
Research Objectives Examine feasibility of microhubs and cyclelogistics Identify conditions under which these solutions can be viable and implemented at scale Recommend actions to support implementation of low-carbon alternative delivery systems 12
Research Approach Alternative Business as usual Suburban Micro-consolidation consolidation + + electric cargo van package car large e-assist cargo bike small e-assist cargo bike 13
Part 1: Determine candidate microhub locations Locations are based on the following criteria: Household and employment density o Zoning (permitted uses) o Road network (not on residential-only streets o or highways) 14
Hamilton 15
Toronto 16
Part 2: Compare different delivery scenarios for microhub locations Business as usual Microhubs with Microhubs with Microhubs with (package car) electric van large cargo bike small cargo bike Off-peak Off-peak Off-peak Off-peak Higher volume Normal congestion Normal congestion Normal congestion Normal congestion (downtown cargo volumes) Higher congestion Higher congestion Higher congestion Higher congestion Off-peak Off-peak Off-peak Off-peak Lower volume Normal congestion Normal congestion Normal congestion Normal congestion (suburban cargo volumes) Higher congestion Higher congestion Higher congestion Higher congestion 17
For each delivery scenario, determine: VKT o Travel time o Optimal fleet size o Use these outputs to calculate (for each delivery scenario): Operational costs (labour, fuel o consumption, and fleet maintenance) Emissions o 18
• Efficient operations Microhubs and • High asset utilization cargo bikes are • viable and Cost effective practical • Lower freight emissions 19
Key Findings Compared to business-as-usual operations, microhubs and cargo cycles have the potential to be more efficient. Total operational time under high congestion, high demand conditions 20
Key Findings Compared to business-as-usual operations, microhubs and cargo cycles have the potential to have higher asset utilization. Number of Optimal fleet Routes per trips* size* vehicle* Small e-assist 28 6 4 to 5 cargo cycle Higher delivery Large e-assist 6 6 1 demand cargo cycle Small electric van 5 5 1 Package car 6 6 1 * Results under high delivery demand conditions. Numbers are the same for each microhub location. 21
Key Findings Compared to business-as-usual operations, microhubs and cargo cycles have the potential to be more cost effective. Average scenario costs under high demand conditions 22
Key Findings Compared to business-as-usual operations, microhubs and cargo cycles have the potential to be greener. Average GHG savings using microhubs and cyclelogistics: 24 53 kg CO 2 /day kg CO 2 /day High demand Low demand conditions conditions 23
Conditions for success Relevance: high current and potential demand Suitability: favourable service area characteristics Feasibility: supporting institutional and economic context From Janjevic et al. (2014) Weather? Safety? 24
Turning ideas into action: Industry Set targets for incorporating low- to zero-emission vehicles in commercial delivery fleets Pilot cargo cycles/other zero-emission vehicles and microhub operations in areas with high delivery density Explore the potential of shared microhub space and using pooled ordering to consolidate deliveries 25
Turning ideas into action: Gov’t Explore policies and incentives to support establishment of microhubs and uptake of zero- or low-emission delivery vehicles Harmonize and clarify e-bike/cargo cycle legislation, regulations, and policies Invest in cycling infrastructure Develop or modernize land use and transportation plans and strategies 26
Questions? Janelle Lee Analyst, Transportation and Urban Solutions janellel@pembina.org
Recommend
More recommend