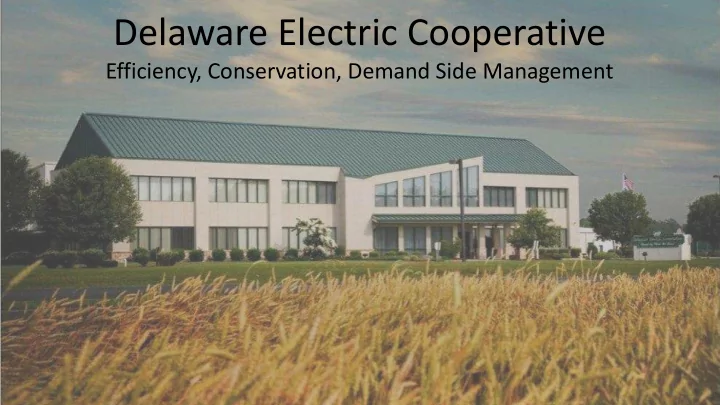

Delaware Electric Cooperative Efficiency, Conservation, Demand Side Management
Efficiency & Conserv rvation
LED Lighting LED vs Incandescent = 80% savings LED vs Mercury Vapor = 75% LED vs High Pressure Sodium =60% CFL Lighting CFL = 145,000 bulbs Savings = 5,500,000 kWh/yr
Poultry ry LED 60 Watt Incandescent 10 Watt LED
Poultry ry LED Energy Usage Energy Cost 7 Flocks 7 Flocks 14,000 $900.00 $800.00 12,000 $700.00 $843.30 12,836 10,000 $600.00 10,279 kWh = 80% Savings $675.31 = 80% Savings 8,000 $500.00 kWh Cost $400.00 6,000 $300.00 4,000 $200.00 2,000 $100.00 $167.99 2,557 - $0.00 Incandescent LED Incandescent LED 60 Watt Incandescent vs 10 Watt LED
Poultry ry LED 2012 = 54 conversions 2013 = 33 conversions 2014 = 106 conversions Total = 193 LED Bulbs = 14,896 Cost = $376,000 Annual Savings = 1,750,000 kWh = $121,000
Dairy ry Farm Efficiency 7 Dairy Farms Cows = 1,538 Annual kWh Usage = 1,173,132 Potential Savings = 315,418 kWh (27%) • Water Heating • Refrigeration • Pumps • Circulation/Cooling • Lighting
Water Heating Geothermal Heating/Cooling Heat Pump Water Heaters = 56 Systems = 438 Solar Hot Water Heaters = 11 Grants = $1,100,000 Grants = $46,800
System Im Improvements System Losses 15,000,000 kWh Savings/yr 12.00% 11.23% 10.00% 8.00% 6.00% • Low loss transformers • Electronic Meters • Reconductoring 4.00% 4.22% • System Operations • Power Factor Correction 2.00% • Load Balancing 0.00% 1980 1981 1982 1983 1984 1985 1986 1987 1988 1989 1990 1991 1992 1993 1994 1995 1996 1997 1998 1999 2000 2001 2002 2003 2004 2005 2006 2007 2008 2009 2010 2011 2012 2013
Demand Side Management
October 15, 2014 CP = HE 20:00 2,500,000 160,000 140,000 2,000,000 144,014 120,000 100,000 1,500,000 kW Load Control 80,000 7 pm - 9 pm 1,000,000 60,000 40,000 500,000 20,000 0 0 0:00 1:00 2:00 3:00 4:00 5:00 6:00 7:00 8:00 9:00 10:00 11:00 12:00 13:00 14:00 15:00 16:00 17:00 18:00 19:00 20:00 21:00 22:00 23:00 DPL Zonal Load DEC Load
Variable Frequency Drives 184 Diesel Generators Converted to Electric
Conservation Voltage Reduction Voltage Reduction of 2.5% - 5.0% = 4.5 MW
Beat The Peak Voluntary Reduction in Usage 49,876 Indicator Lights 51,193 Email Addresses Switch & Save Switches = 21,138 Water Heaters = 17,342 AC/HP = 9,856 Total Appliances = 27,198
Solar Bruce A. Henry Solar Energy Farm 4 MW = 6,500,000 kWh/yr 506 Installations = 3.6 MW/ac Avg. = 5.8 kW Max. = 1.2 MW Grants = $2,000,000 DEC Generation = 4.0 MW/ac Total = 7.6 MW/ac 12,500,000 kWh/yr
June 18, 2014 CP = HE 18:00 350,000 4,000 3,500 300,000 3,000 250,000 2,000 kW 2,500 200,000 kW Load Control 2,000 16:00 - 18:00 150,000 1,500 100,000 1,000 50,000 500 0 0 0:00 1:00 2:00 3:00 4:00 5:00 6:00 7:00 8:00 9:00 10:00 11:00 12:00 13:00 14:00 15:00 16:00 17:00 18:00 19:00 20:00 21:00 22:00 23:00 DEC Load PV Generation
In Interruptible Rate Poultry Houses, Irrigation, Schools, Business = 955
Time of f Use Rates • Residential • Residential Space Heating • General Service • Irrigation
Mark A. Nielson VP Staff Services mnielson@decoop.com 302.381.9232
Recommend
More recommend