Debugging a Memory Manager Karl Cronburg karl@cs.tufts.edu Tufts - PowerPoint PPT Presentation
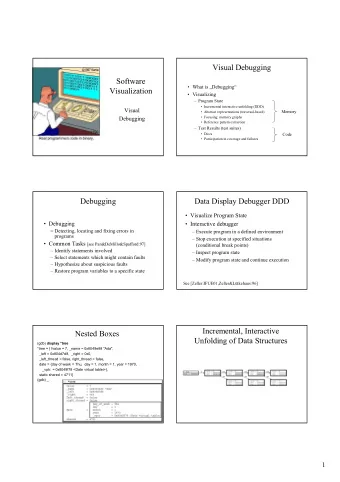
Debugging a Memory Manager Karl Cronburg karl@cs.tufts.edu Tufts University The Problem How do we guarantee correctness of a memory management system? Difficulties include: Complex garbage collection (GC) algorithms Static analysis
Debugging a Memory Manager Karl Cronburg karl@cs.tufts.edu Tufts University
The Problem How do we guarantee correctness of a memory management system? Difficulties include: ◮ Complex garbage collection (GC) algorithms ◮ Static analysis computationally infeasible ◮ Loss of type information ◮ Implicit memory layouts (only described in code comments) ◮ Pointer safety xkcd.com/138
Motivation ◮ Growing popularity of memory-safe systems ◮ Someone has to implement and debug these systems ◮ Ensuring that the memory manager ◮ respects application-system boundaries ◮ handles its own memory appropriately ◮ It matters which code is touching which parts of memory and when
Background: Existing Debugging Techniques ◮ Printf / log-based ◮ Sanity checking / assertions
Background: Existing Debugging Techniques ◮ Printf / log-based ◮ Sanity checking / assertions Why are these techniques unsatisfactory?
Background: Existing Debugging Techniques ◮ Printf / log-based ◮ Sanity checking / assertions Why are these techniques unsatisfactory? ◮ Time consuming & tedious - custom analysis of log files
Background: Existing Debugging Techniques ◮ Printf / log-based ◮ Sanity checking / assertions Why are these techniques unsatisfactory? ◮ Time consuming & tedious - custom analysis of log files ◮ Program slow-down
Background: Existing Debugging Techniques ◮ Printf / log-based ◮ Sanity checking / assertions Why are these techniques unsatisfactory? ◮ Time consuming & tedious - custom analysis of log files ◮ Program slow-down ◮ Disk space - log files
Background: Existing Debugging Techniques ◮ Printf / log-based ◮ Sanity checking / assertions Why are these techniques unsatisfactory? ◮ Time consuming & tedious - custom analysis of log files ◮ Program slow-down ◮ Disk space - log files ◮ Ad-hoc - correctness of debugging assertions
Background: Existing Debugging Techniques ◮ Printf / log-based ◮ Sanity checking / assertions Why are these techniques unsatisfactory? ◮ Time consuming & tedious - custom analysis of log files ◮ Program slow-down ◮ Disk space - log files ◮ Ad-hoc - correctness of debugging assertions ◮ Incomplete - weak guarantee of program correctness
Background: Existing Debugging Techniques ◮ Printf / log-based ◮ Sanity checking / assertions Why are these techniques unsatisfactory? ◮ Time consuming & tedious - custom analysis of log files ◮ Program slow-down ◮ Disk space - log files ◮ Ad-hoc - correctness of debugging assertions ◮ Incomplete - weak guarantee of program correctness ◮ Lack of isolation
Background: Existing Debugging Tools ◮ General purpose: ◮ Valgrind / Memcheck - dynamic binary instrumentation ◮ GDB - breakpoints, instruction stepping, memory inspection 1 2
Background: Existing Debugging Tools ◮ General purpose: ◮ Valgrind / Memcheck - dynamic binary instrumentation ◮ GDB - breakpoints, instruction stepping, memory inspection ◮ Memory manager specific tools: ◮ RDB 1 - GDB-like JVM debugger ◮ Elephant Tracks 2 - log-based JVM inspection tool 1 Makarov & Hauswirth 2013 2 Ricci, Guyer, Moss 2013
Background: Existing Debugging Tools ◮ General purpose: ◮ Valgrind / Memcheck - dynamic binary instrumentation ◮ GDB - breakpoints, instruction stepping, memory inspection ◮ Memory manager specific tools: ◮ RDB 1 - GDB-like JVM debugger ◮ Elephant Tracks 2 - log-based JVM inspection tool ◮ Other system & language specific tools: ◮ Printf Debugger (for C) ◮ Various IDE plugins (e.g. for Eclipse) So why are these tools not always sufficient? 1 Makarov & Hauswirth 2013 2 Ricci, Guyer, Moss 2013
Background: Existing Debugging Tools ◮ General purpose: ◮ Valgrind / Memcheck - dynamic binary instrumentation ◮ GDB - breakpoints, instruction stepping, memory inspection ◮ Memory manager specific tools: ◮ RDB 1 - GDB-like JVM debugger ◮ Elephant Tracks 2 - log-based JVM inspection tool ◮ Other system & language specific tools: ◮ Printf Debugger (for C) ◮ Various IDE plugins (e.g. for Eclipse) So why are these tools not always sufficient? ◮ Source vs binary level information 1 Makarov & Hauswirth 2013 2 Ricci, Guyer, Moss 2013
Background: Existing Debugging Tools ◮ General purpose: ◮ Valgrind / Memcheck - dynamic binary instrumentation ◮ GDB - breakpoints, instruction stepping, memory inspection ◮ Memory manager specific tools: ◮ RDB 1 - GDB-like JVM debugger ◮ Elephant Tracks 2 - log-based JVM inspection tool ◮ Other system & language specific tools: ◮ Printf Debugger (for C) ◮ Various IDE plugins (e.g. for Eclipse) So why are these tools not always sufficient? ◮ Source vs binary level information ◮ Inspection vs bug detection 1 Makarov & Hauswirth 2013 2 Ricci, Guyer, Moss 2013
Background: Existing Debugging Tools ◮ General purpose: ◮ Valgrind / Memcheck - dynamic binary instrumentation ◮ GDB - breakpoints, instruction stepping, memory inspection ◮ Memory manager specific tools: ◮ RDB 1 - GDB-like JVM debugger ◮ Elephant Tracks 2 - log-based JVM inspection tool ◮ Other system & language specific tools: ◮ Printf Debugger (for C) ◮ Various IDE plugins (e.g. for Eclipse) So why are these tools not always sufficient? ◮ Source vs binary level information ◮ Inspection vs bug detection ◮ Language compatibility 1 Makarov & Hauswirth 2013 2 Ricci, Guyer, Moss 2013
Our Focus: Distinguishing Data and Meta Data ◮ Want to codify memory layout - which addresses correspond to: ◮ meta data - object header bits, free list, etc. ◮ data - allocated objects ◮ Which methods can operate on a specific piece of memory ◮ Memcheck 1 is close to what we want, however: ◮ Distinguishes allocated & unallocated data ◮ Doesn’t distinguish data and meta data Normal reads and writes: 1 Detection tool for memory related bugs (Seward & Nethercote 2005)
Our Focus: Distinguishing Data and Meta Data ◮ Want to codify memory layout - which addresses correspond to: ◮ meta data - object header bits, free list, etc. ◮ data - allocated objects ◮ Which methods can operate on a specific piece of memory ◮ Memcheck 1 is close to what we want, however: ◮ Distinguishes allocated & unallocated data ◮ Doesn’t distinguish data and meta data Code with bug(s) distinguishing data / meta data: 1 Detection tool for memory related bugs (Seward & Nethercote 2005)
Our Focus: Distinguishing Data and Meta Data ◮ Want to codify memory layout - which addresses correspond to: ◮ meta data - object header bits, free list, etc. ◮ data - allocated objects ◮ Which methods can operate on a specific piece of memory ◮ Memcheck 1 is close to what we want, however: ◮ Distinguishes allocated & unallocated data ◮ Doesn’t distinguish data and meta data Subtleties - e.g. some application code can access meta data: 1 Detection tool for memory related bugs (Seward & Nethercote 2005)
Our Focus: Distinguishing Data and Meta Data ◮ Want to codify memory layout - which addresses correspond to: ◮ meta data - object header bits, free list, etc. ◮ data - allocated objects ◮ Which methods can operate on a specific piece of memory ◮ Memcheck 1 is close to what we want, however: ◮ Distinguishes allocated & unallocated data ◮ Doesn’t distinguish data and meta data Solution - mediate special cases with read / write barriers: 1 Detection tool for memory related bugs (Seward & Nethercote 2005)
Memory Management Bugs ◮ Causes of some memory related bugs: ◮ Explicit memory handling (pointers) ◮ Implicit memory layout (e.g. implicit headers) ◮ GC algorithm complexity ◮ GC correctness bug symptoms include . . . Example heap:
Memory Management Bugs ◮ Causes of some memory related bugs: ◮ Explicit memory handling (pointers) ◮ Implicit memory layout (e.g. implicit headers) ◮ GC algorithm complexity ◮ GC correctness bug symptoms include . . . ◮ Use after free - object incorrectly freed Heap with possible use-after free:
Memory Management Bugs ◮ Causes of some memory related bugs: ◮ Explicit memory handling (pointers) ◮ Implicit memory layout (e.g. implicit headers) ◮ GC algorithm complexity ◮ GC correctness bug symptoms include . . . ◮ Use after free - object incorrectly freed ◮ Memory leak - object incorrectly retained Heap with memory leak:
Memory Management Bugs ◮ Causes of some memory related bugs: ◮ Explicit memory handling (pointers) ◮ Implicit memory layout (e.g. implicit headers) ◮ GC algorithm complexity ◮ GC correctness bug symptoms include . . . ◮ Use after free - object incorrectly freed ◮ Memory leak - object incorrectly retained ◮ Memory corruption - overwriting memory Corrupted heap:
Memory Management Bugs ◮ Causes of some memory related bugs: ◮ Explicit memory handling (pointers) ◮ Implicit memory layout (e.g. implicit headers) ◮ GC algorithm complexity ◮ GC correctness bug symptoms include . . . ◮ Use after free - object incorrectly freed ◮ Memory leak - object incorrectly retained ◮ Memory corruption - overwriting memory ◮ Altered control flow - incorrect code executing Altered control flow - heap implications:
Recommend
More recommend
Explore More Topics
Stay informed with curated content and fresh updates.
