
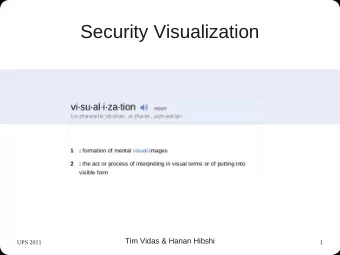
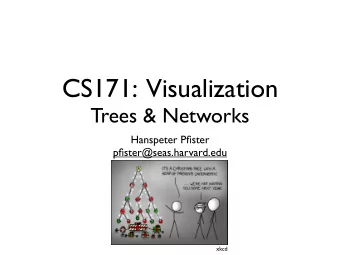
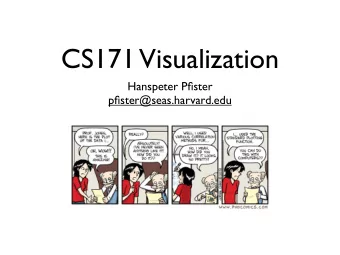
CS171 Visualization Alexander Lex alex@seas.harvard.edu Graphs - PowerPoint PPT Presentation
CS171 Visualization Alexander Lex alex@seas.harvard.edu Graphs [xkcd] This Week Reading: VAD, Chapters 9 Lecture 12: Text & Documents Sections: D3 and JS Design Guidelines. HW1 Review. Updates Design Studio moved to Tuesday after
CS171 Visualization Alexander Lex alex@seas.harvard.edu Graphs [xkcd]
This Week Reading: VAD, Chapters 9 Lecture 12: Text & Documents Sections: D3 and JS Design Guidelines. HW1 Review. Updates Design Studio moved to Tuesday after Spring-Break HW 4 consists of “only” the project proposal
Design Exercise Data & Use Case by Augusto Sandoval
Student question: How to show this data? ID Gender High School Type Degree Year of Admission GPA GPA z-score
Visualizing Categorical Data Example: Parallel Sets
Last Week: Highdimensional Data
Analytic Component Multidimensional Scaling Scatterplot Matrices [Doerk 2011] [Bostock] Pixel-based visualizations / heat maps Parallel Coordinates [Bostock] [Chuang 2012] no / little analytics strong analytics component
Geometric Methods
Parallel Coordinates (PC) Inselberg 1985 Axes represent attributes Lines connecting axes represent items X A A B B B A Y X Y
Parallel Coordinates Each axis represents dimension Lines connecting axis represent records Suitable for all tabular data types heterogeneous data
PC Limitation: Scalability to Many Dimensions 500 axes
PC Limitations Correlations only between adjacent axes Solution: Interaction Brushing Let user change order
Parallel Coordinates Algorithmic support: Shows primarily relationships between adjacent axis Choosing dimensions Limited scalability (~50 Choosing order dimensions, ~1-5k records) Clustering & aggregating Transparency of lines Interaction is crucial records Axis reordering Brushing Filtering http://bl.ocks.org/jasondavies/1341281
Star Plot [Coekin1969] Similar to parallel coordinates Radiate from a common origin http://www.itl.nist.gov/div898/handbook/eda/section3/starplot.htm http://bl.ocks.org/kevinschaul/raw/8833989/ http://start1.jpl.nasa.gov/caseStudies/autoTool.cfm
Scatterplot Matrices (SPLOM) Matrix of size d*d Each row/column is one dimension Each cell plots a scatterplot of two dimensions
Scatterplot Matrices Limited scalability (~20 Algorithmic approaches: dimensions, ~500-1k Clustering & aggregating records) records Brushing is important Choosing dimensions Often combined with “Focus Choosing order Scatterplot” as F+C technique
Flexible Linked Axes (FLINA) Claessen & van Wijk 2011
Data Reduction Sampling Filtering Don’t show every element, show a Define criteria to remove data, e.g., (random) subset minimum variability > / < / = specific value for one dimension Efficient for large dataset consistency in replicates, … Apply only for display purposes Can be interactive, combined with Outlier-preserving approaches sampling [Ellis & Dix, 2006]
Pixel Based Methods
Pixel Based Displays Each cell is a “pixel”, value encoded in color / value Meaning derived from ordering If no ordering inherent, clustering is used Scalable – 1 px per item Good for homogeneous data same scale & type [Gehlenborg & Wong 2012]
Bad Color Mapping
Good Color Mapping
Color is relative!
Clustering Classification of items into “similar” Hierarchical Algorithms bins Produce “similarity tree” – Based on similarity measures dendrogram Euclidean distance, Pearson Bi-Clustering correlation, ... Clusters dimensions & records Partitional Algorithms divide data into set of bins Fuzzy clustering # bins either manually set (e.g., k- allows occurrence of elements means) or automatically determined in multiples clusters (e.g., affinity propagation)
Clustering Applications Clusters can be used to order (pixel based techniques) brush (geometric techniques) aggregate Aggregation cluster more homogeneous than whole dataset statistical measures, distributions, etc. more meaningful
Clustered Heat Map
Dimensionality Reduction
Dimensionality Reduction Reduce high dimensional to lower dimensional space Preserve as much of variation as possible Plot lower dimensional space Principal Component Analysis (PCA) linear mapping, by order of variance
Multidimensional Scaling Nonlinear, better suited for some DS Popular for text analysis [Doerk 2011]
Can we Trust Dimensionality Reduction? Topical distances between departments in Topical distances between the selected a 2D projection Petroleum Engineering and the others. [Chuang et al., 2012] http://www-nlp.stanford.edu/projects/dissertations/browser.html
Design Critique
OECD: http://goo.gl/QfxHfv http://www.oecdregionalwellbeing.org/
Graph Visualization Based on Slides by HJ Schulz and M Streit
Applications of Graphs Without graphs, there would be none of these:
Michal ¡2000
www.itechnews.net
Graph Visualization Case Study
Graph Theory Fundamentals Tree Network Hypergraph Bipartite ¡Graph
Königsberg Bridge Problem (1736) Find a Hamiltonian Path (path that visits each vertex exactly once). Want to make 1 million $? Develop O(n^k) algorithm.
Graph Terms (1) A graph G(V,E) consists of a set of vertices V (also called nodes) and a set of edges E connecting these vertices.
Graph Terms (2) A simple graph G(V,E) is a graph which contains no multi-edges and no loops Not ¡a ¡simple ¡graph! à A ¡ general ¡graph
Graph Terms (3) A directed graph (digraph) is a graph that discerns between the edges and . A B A B A hypergraph is a graph with edges connecting Hypergraph ¡Example any number of vertices.
Graph Terms (4) Independent Set G contains no edges Independent ¡Set Clique G contains all possible edges Clique
Graph Terms (5) Path G contains only edges that can be consecutively traversed Path Tree G contains no cycles Network G contains cycles Tree
Graph Terms (6) Unconnected graph An edge traversal starting from a given vertex cannot reach any other vertex. Unconnected ¡Graph Articulation point Vertices, which if deleted from the graph, would break up the graph in multiple sub-graphs. Articulation ¡Point ¡(red)
Graph Terms (7) Biconnected graph A graph without articulation points. Biconnected ¡Graph Bipartite graph The vertices can be partitioned in two independent sets. Bipartite ¡Graph
Tree A graph with no cycles - or: A collection of nodes contains a root node and 0-n subtrees subtrees are connected to root by an edge root T 1 T 2 T 3 T n …
Ordered Tree A A B C D B D C ≠ E F G I F E G I H H
Binary Trees Contains no nodes, or Is comprised of three disjoint sets of nodes: C a root node, G F a binary tree called its left subtree, and H a binary tree called its right subtree ≠ C root G F H LT RT
Different Kinds of Graphs Over ¡1000 ¡different ¡graph ¡classes Tree Bipartite ¡Graph Network Hypergraph A. ¡Brandstädt ¡et ¡al. ¡1999
Graph Measures Node degree deg(x) The number of edges being incident to this node. For directed graphs indeg/outdeg are considered separately. Diameter of graph G The longest shortest path within G. Pagerank count number & quality of links [Wikipedia]
Graph Algorithms (1) Traversal: Breadth First Search, Depth First Search BFS DFS -‑ classical ¡way-‑finding/back-‑tracking ¡ -‑ generates ¡neighborhoods ¡ strategy ¡ -‑ hierarchy ¡gets ¡rather ¡wide ¡ -‑ tree ¡serialization ¡ than ¡deep ¡ -‑ topological ¡ordering -‑ solves ¡single-‑source ¡shortest ¡ paths ¡(SSSP) ¡
Hard Graph Algorithms (NP-Complete) Longest path Largest clique Maximum independent set (set of vertices in a graph, no two of which are adjacent) Maximum cut (separation of vertices in two sets that cuts most edges) Hamiltonian path/cycle (path that visits all vertexes once) Coloring / chromatic number (colors for vertices where no adjacent v. have same color) Minimum degree spanning tree
Graph and Tree Visualization
Setting the Stage Interaction GRAPHICAL GRAPH ¡DATA GOAL ¡/ ¡TASK REPRESENTATION Visualization How ¡to ¡decide ¡which ¡ representation ¡to ¡use ¡for ¡which ¡ type ¡of ¡ graph ¡in ¡order ¡to ¡achieve ¡which ¡kind ¡of ¡ goal ?
Different Kinds of Tasks/Goals Two principal types of tasks: attribute-based (ABT) and topology-based (TBT) Localize – find a single or multiple nodes/edges that fulfill a given property • ABT: Find the edge(s) with the maximum edge weight. • TBT: Find all adjacent nodes of a given node. Quantify – count or estimate a numerical property of the graph • ABT: Give the number of all nodes. • TBT: Give the indegree (the number of incoming edges) of a node. Sort/Orde r – enumerate the nodes/edges according to a given criterion • ABT: Sort all edges according to their weight. • TBT: Traverse the graph starting from a given node. list ¡adapted ¡from ¡Schulz ¡2010
Recommend
![CS171 Visualization Alexander Lex alex@seas.harvard.edu Tables [xkcd] This Week Reading: VAD,](https://c.sambuz.com/986063/cs171-visualization-s.webp)


![CS171 Visualization Alexander Lex alex@seas.harvard.edu Graphs Part II [xkcd] This Week](https://c.sambuz.com/723696/cs171-visualization-s.webp)
![CS171 Visualization Alexander Lex alex@seas.harvard.edu [xkcd] vi su al i za tion](https://c.sambuz.com/744411/cs171-visualization-s.webp)
![CS171 Visualization Alexander Lex alex@seas.harvard.edu Maps [xkcd] Homework 2 Review Grade](https://c.sambuz.com/767293/cs171-visualization-s.webp)
![CS171 Visualization Alexander Lex alex@seas.harvard.edu Design Guidelines Tasks [xkcd] Next](https://c.sambuz.com/864402/cs171-visualization-s.webp)
![CS171 Visualization Alexander Lex alex@seas.harvard.edu Tables Part II [xkcd] Next Week](https://c.sambuz.com/935554/cs171-visualization-s.webp)


More recommend
Explore More Topics
Stay informed with curated content and fresh updates.