
Comparison between perf, Ftrace, LTTng and GDB tracepoints Rafik - PowerPoint PPT Presentation
Comparison between perf, Ftrace, LTTng and GDB tracepoints Rafik Fahem Department of Computer and Software Engineering June 29, 2010 cole Polytechnique, Montreal 1 Content Perf Ftrace LTTng GDB tracepoints Discussion Questions
Comparison between perf, Ftrace, LTTng and GDB tracepoints Rafik Fahem Department of Computer and Software Engineering June 29, 2010 École Polytechnique, Montreal 1
Content Perf Ftrace LTTng GDB tracepoints Discussion Questions Comparison between perf, Ftrace, LTTng and GDB tracepoints 2 2
Perf ● Used for performance analysis ● Static tracepoints: ● Makes use of the tracepoints available in the kernel(version 2.6.32 and higher) ● Dynamic tracepoints can be defined with: ● Symbols and registers without debuginfo ● C line numbers, function names and local variables with debuginfo Comparison between perf, Ftrace, LTTng and GDB tracepoints 3 3
Perf ● Dynamic tracepoints are implemented with kprobes ● Vmlinux containing the debuginfo has to be a Dwarf binary ● Traces only the events generated by a specific program Comparison between perf, Ftrace, LTTng and GDB tracepoints 4 4
Perf ● Available data: ● Number of times the tracepoint was hit ● Execution time ● Calling functions ● Trace is available only after execution Comparison between perf, Ftrace, LTTng and GDB tracepoints 5 5
Ftrace ● Can be used for debugging and latency analysis ● Includes six different tracers: function calls, context switches...etc ● Uses the static tracepoints available in the kernel source ● Dynamic tracepoints unavailable Comparison between perf, Ftrace, LTTng and GDB tracepoints 6 6
Ftrace ● Available data depends on the tracer enabled: execution time, calling functions, PIDs... ● Thousands of filters available to trace only some selected events ● Trace is recorded in debugfs ● Trace can be viewed when tracing Comparison between perf, Ftrace, LTTng and GDB tracepoints 7 7
LTTng ● Optimized for static tracing ● Uses the static tracepoints available in the kernel ● Dynamic tracepoints implemented using kprobes ● Several probes can be connected to the same tracepoint ● Live monitoring under development Comparison between perf, Ftrace, LTTng and GDB tracepoints 8 8
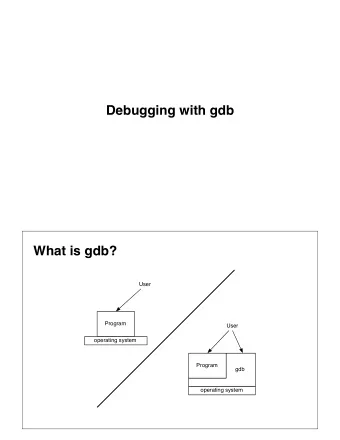
GDB tracepoints ● Can only be used in user space ● Only dynamic tracepoints are supported in the current version ● UST tracepoints can be used ● Tracepoints inserted using traps ● Fast tracepoints: ● Faster but restricted in where they may be installed ● Inserted with a jump Comparison between perf, Ftrace, LTTng and GDB tracepoints 9 9
GDB tracepoints ● Data collected can include registers, local variables and global data. ● Tracepoints can be defined with line numbers, function names and addresses ● A trace snapshot is collected every time a tracepoint is hit ● These snapshots are stored in buffers and can be examined later Comparison between perf, Ftrace, LTTng and GDB tracepoints 10 10
Discussion ● Perf: ● Tracing a single program ● Statistics: execution time, calling functions, number of times the tracepoint was hit ● Hardware performance counters ● Ftrace: ● Filters ● Trace in debugfs Comparison between perf, Ftrace, LTTng and GDB tracepoints 11 11
Discussion ● LTTng: ● Optimized static tracing ● User-space tracing ● Trace streaming ● GDB tracepoints: ● Fast tracepoints using jumps ● Debuginfo is needed to access variables(SystemTap) Comparison between perf, Ftrace, LTTng and GDB tracepoints 12 12
Questions? Comparison between perf, Ftrace, LTTng and GDB tracepoints 13 13
Recommend


More recommend
Explore More Topics
Stay informed with curated content and fresh updates.