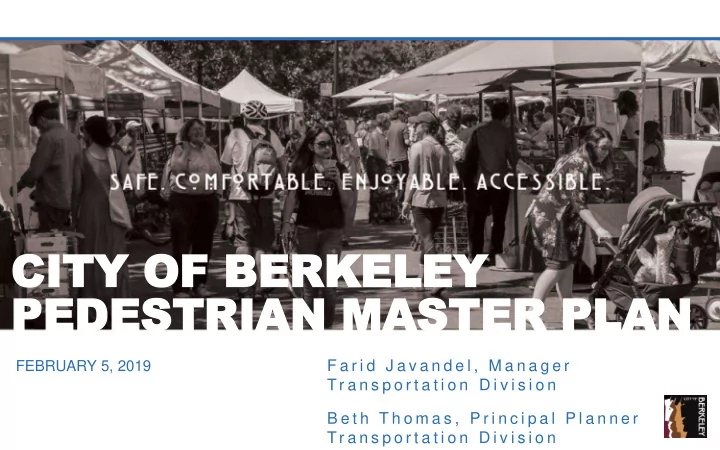

CITY CITY OF OF BER BERKELEY KELEY PEDESTRIA PEDESTRIAN N MASTER MASTER PLAN PLAN FEBRUARY 5, 2019 F a r i d J a v a n d e l , M a n a g e r Tr a n s p o r t a t i o n D i v i s i o n B e t h T h o m a s , P r i n c i p a l P l a n n e r Tr a n s p o r t a t i o n D i v i s i o n
Agenda Plan Overview Public Engagement Components of the Plan Next Steps Questions & Comments
Plan Overview » Regular updates required for grant eligibility » Safety-focused, consistent with Vision Zero Policy » Scope: Vision and Goals Existing Conditions & Needs Analysis Project Prioritization Citywide Programs
Project Schedule Public Engagement Project & Program Vision & Goals Recommendations Existing Conditions & Draft & Final Plan Needs Analysis MAY JUN JUL AUG SEP OCT NOV DEC JAN FEB MAR APR MAY JUN 2018 2019 We are here
Overview of Engagement Activities In-Person Online Project website Community events Interactive map Public open houses Public survey Transportation Commission Pedestrian Subcommittee
In-Person Events » Sunday Streets, 6/3 » Fourth of July, 7/4 » South Farmer’s Market, 7/10 » North Farmer’s Market, 7/12 » Ashby Flea Market, 7/14 » Dtwn Farmer’s Market, 7/21 » Kite Festival, 7/28 Frances Albrier, 12/1 » Caltopia, 8/19 » Open House at Frances Albrier Community Center, 12/1
In-Person Events Level of Engagement • 8 events / 44 hours gathering input • ~20 comments per hour / ~880 unique comments What we Heard • Focus on crossings and sidewalk quality • Interest in pedestrianized areas and more amenities • Streets mentioned most: Shattuck, Martin Luther King, University, Ashby, San Pablo, Sacramento, Center, Dwight, Marin, Telegraph, Virginia, Adeline, Haste, Oxford
Project Website Interactive Map WalkBerkeley.info
Level of Engagement • 50 unique commenters / 259 comments What we Heard • 32 marks for Routes I Like • 48 marks for Uncomfortable Routes • 86 marks for Barriers • 69 marks for Destinations • 24 marks for Great Streets and Paths
Proposed Vision Berkeley is a model walkable city where traveling on foot or with an assistive device is safe , comfortable , and convenient for people of all ages and abilities
Safety & Equity & Public Health & Comfort Choices Environment Proposed Goal Areas
Proposed Goals & Performance Measures Goals Performance Measures Reduce pedestrian Implement safety treatments at critical locations on all high-injury corridors by 2028 fatalities and severe injuries to 0 by 2028 Reduce speeding on high-injury corridors Achieve equity and Make XX% of pedestrian-related extend transportation investments over next 10 years in Berkeley’s historically underserved choices to all communities Maintain Berkeley’s status as #1 in the Improve public health and the environment State for walking commute rate
Estimated Pedestrian Demand » Destination-choice model uses data from City of Berkeley, Alameda County, and Census » Areas of highest demand are: Downtown Berkeley BART UC Berkeley campus Commercial corridors and employment centers Estimated Weekly Pedestrian Volumes
Focus on Severity – Consistent with Vision Zero Policy Pedestrian Collisions, 2008-2017 Fatalities Severe Injuries
Pedestrian High Injury Corridors Pedestrian Collisions, 2008-2017 Fatalities Severe Injuries High Injury Corridors 14% of Berkeley's street miles account for 93% of pedestrian fatalities & severe injuries.
Who is Most Affected? (SWITRS data 2012-2016) Pedestrian Race Pedestrian Age 35.0% 55.5% 60.0% 30.4% 50.0% 42.9% 28.4% 30.0% 27.3% 40.0% 25.5% 25.0% 30.0% 22.5% 19.1% 18.4% 11.1% 15.3% 20.3% 13.9% 20.0% 9.5% 8.2% 20.0% 6.1% 10.0% 14.3% 13.7% 0.0% 15.0% White Asian Hispanic African Other/Not 10.3% American Stated 10.0% 5.9% Share of Berkeley Residents 5.0% Share of Pedestrians Involved in Collisions 1.5% 0.0% < 15 15-24 25-44 45 to 64 65+ (Not stated) Share of Berkeley Residents Share of Pedestrians Involved in Collisions
Proposed Prioritization Framework Factor Description Safety Concentration of severe and fatal collisions Equity Historically underserved neighborhoods Proximity to*: Considers network distance to destinations: Schools 0.25-mi from K-12 schools, UC Berkeley & City College Transit 0.50-mi from major transit stop Commercial Area 0.50-mi from shopping and employment center Parks 0.25-mi from park or open space * Considering using pedestrian demand estimation model instead of destination proximity.
Programs & Guidance Anticipated Focus Areas » Street lighting & red curbs focusing on pedestrian crossings » Crosswalk Policy » Pedestrian signal automated recall paralleling arterials » Traffic calming in relation to emergency vehicle access
Next Steps Public & Transportation Commission Engagement » Pedestrian Subcommittee Meeting #2, Feb/March 2019 » Transportation Commission Meeting, March/April 2019 » Public Open House #2, March/April 2019
Next Steps Vision Zero Task Force Meetings » Introduction to Vision Zero Action Plan & Purpose, Feb/March 2019 » Best Practices & Benchmarking Assessment, April/May 2019 » Draft Actions Workshops, June 2019 » Action Items Prioritization, July 2019 » City Council Action Plan Adoption, Fall 2019
Questions & Comments
Recommend
More recommend