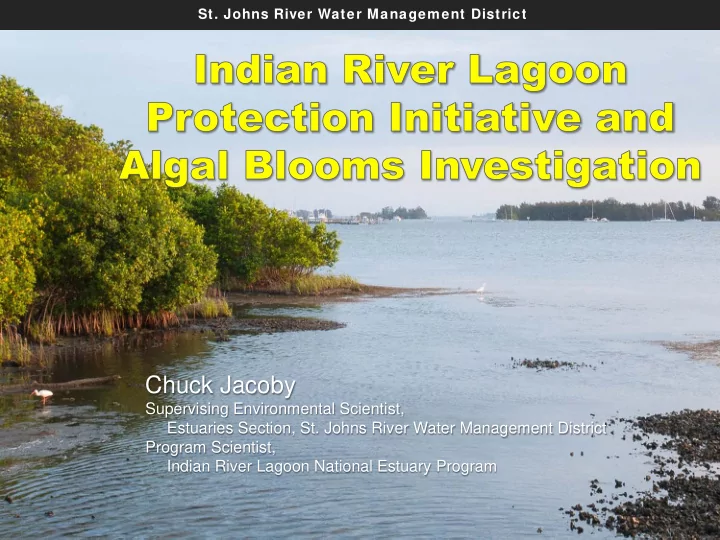

St. Johns River Water Management District St. Johns River Water Management District Chuck Jacoby Supervising Environmental Scientist, Estuaries Section, St. Johns River Water Management District Program Scientist, Indian River Lagoon National Estuary Program
St. Johns River Water Management District St. Johns River Water Management District St. Johns River Water Management District Lagoon is: • Sensitive New Smyrna Beach • Long (156 miles) Mosquito Lagoon • Shallow • Wind & tide driven Banana River • Not a river (no flow) • Segmented (flushing 2 wks–3 mos) Indian River • Diverse – ecology – challenges West Palm Beach
St. Johns River Water Management District St. Johns River Water Management District St. Johns River Water Management District Nutrient impairment • Total Maximum Daily Load (TMDL) = safe load • Loads + Margin of Safety > TMDL ⇒ reductions • Adaptive approach to uncertainty – monitor (seagrass = a key indicator) – evaluate progress – adapt as needed • Summarize in Basin Management Action Plans
St. Johns River Water Management District St. Johns River Water Management District St. Johns River Water Management District Seagrasses 80,000 70,000 60,000 Seagrass area (acres) 50,000 40,000 30,000 20,000 10,000 0 Mapping years (Historic coverage) Drought & Mini- Vero WWTP discharge ⇓ TS Fay drought flushing ‘04 hurricanes Drought & surge & flushing IRFWCD discharge ⇓
St. Johns River Water Management District St. Johns River Water Management District St. Johns River Water Management District Algal blooms
St. Johns River Water Management District St. Johns River Water Management District St. Johns River Water Management District Seagrasses 80,000 70,000 60,000 Seagrass area (acres) 50,000 40,000 30,000 20,000 10,000 0 (Historic Mapping years coverage) Loss of ~30,000 acres ~45% of the acres mapped in 2009
St. Johns River Water Management District St. Johns River Water Management District St. Johns River Water Management District Seagrasses 80,000 70,000 60,000 Seagrass area (acres) 50,000 40,000 30,000 20,000 10,000 0 Mapping years (Historic coverage) Some recovery in 2013 ~12% gain from 2011 – not uniform
St. Johns River Water Management District St. Johns River Water Management District St. Johns River Water Management District What happened?
St. Johns River Water Management District St. Johns River Water Management District St. Johns River Water Management District Caveats “All models are wrong; some models are useful.” (attributed to George Box) “Ecosystems are not only more complex than we think, they are more complex than we can think.” (Egler, Frank. 1977. The nature of vegetation: its management and mismanagement . Aton Forest Publishers , Norfolk, Connecticut) “It’s tough to make predictions, especially about the future.” (Yogi Berra)
St. Johns River Water Management District St. Johns River Water Management District St. Johns River Water Management District
St. Johns River Water Management District St. Johns River Water Management District St. Johns River Water Management District Eutrophication progression scheme Increased nutrient delivery Enhanced growth phytoplankton & macroalgae Increased shading & benthic respiration Adapted from Seagrass loss C.M. Duarte (1995)
St. Johns River Water Management District St. Johns River Water Management District St. Johns River Water Management District What w ill w e do?
St. Johns River Water Management District Indian River Lagoon Protection Initiative
St. Johns River Water Management District St. Johns River Water Management District St. Johns River Water Management District Indian River Lagoon Algal Blooms Investigation South Mosquito Project location = Lagoon Titusville 2011 superbloom area North Timeframe = Indian River 4 years Lagoon Banana River Lagoon North IRL Red hatching Eau Gallie Banana seagrass loss River Lagoon 2009 – 2011
St. Johns River Water Management District St. Johns River Water Management District St. Johns River Water Management District Blue Team • Enhanced sampling – event sampling of inputs – atmospheric deposition – sensors for continuous data – bacterioplankton – phytoplankton – microzooplankton • Updated & enhanced models • Nutrition for bloom species • Grazing by microzooplankton
St. Johns River Water Management District St. Johns River Water Management District St. Johns River Water Management District Sand Team • Sediment survey • Groundwater model • Internal nutrient budget (flux) nearshore nearshore seepage East West seepage face face Lagoon strong recirculation Intracoastal terrestrial recirculation terrestrial advection recirculation diffusion submarine submarine Waterway diffusion strong groundwater groundwater discharge advection discharge muck weak advection weak advection
St. Johns River Water Management District St. Johns River Water Management District St. Johns River Water Management District Green Team • Seagrass transplanting • Drift algae mapping • Drift algae tolerance – temperature – salinity – light Figure 1. Map of donor and recipient sites in this study. • Nutrient content & release – drift algae – seagrasses
St. Johns River Water Management District St. Johns River Water Management District St. Johns River Water Management District Orange Team • Enhanced sampling – fisheries independent monitoring – macrozooplankton – infauna – epifauna • Grazing – macrozooplankton – infauna – epifauna
St. Johns River Water Management District St. Johns River Water Management District St. Johns River Water Management District Goals • Understand – the lagoon’s nutrient inventory & cycling – processes that regulate blooms • Evaluate & recommend strategies – ameliorate blooms o magnitude o duration o frequency – facilitate seagrass growth & expansion – enhance diverse trophic structure
St. Johns River Water Management District St. Johns River Water Management District St. Johns River Water Management District Thank you for your time
Recommend
More recommend