
SLIDE 1
Faculty of Environmental Sciences, Institute of Cartography
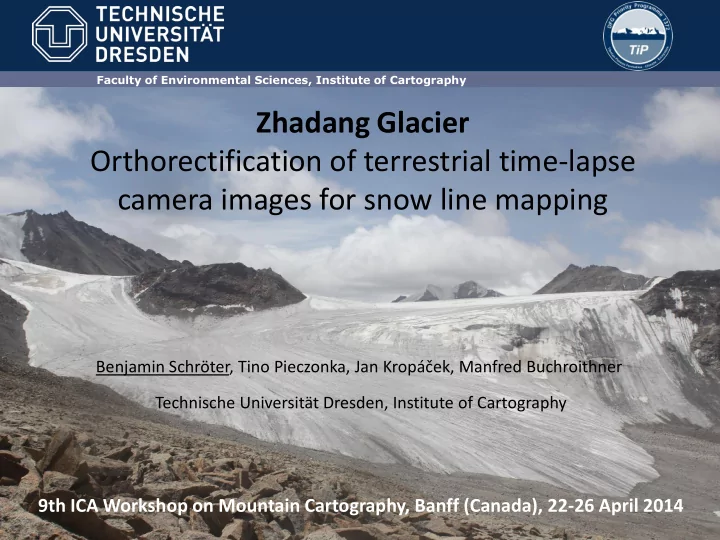
Zhadang Glacier Orthorectification of terrestrial time-lapse camera images for snow line mapping
Benjamin Schröter, Tino Pieczonka, Jan Kropáček, Manfred Buchroithner Technische Universität Dresden, Institute of Cartography