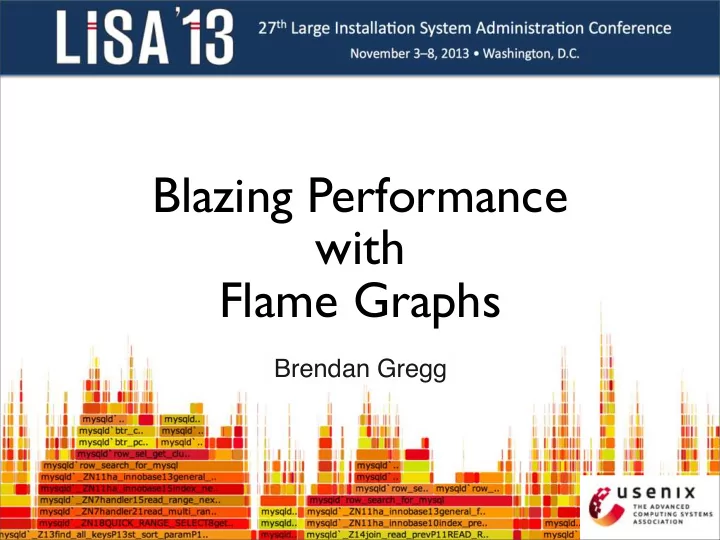
Blazing Performance with Flame Graphs Brendan Gregg An - PowerPoint PPT Presentation
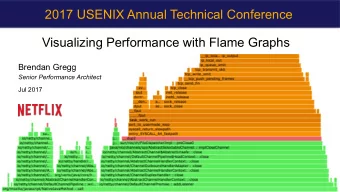
Blazing Performance with Flame Graphs Brendan Gregg An Interactive Visualization for Stack Traces My Previous Visualizations Include Latency Heat Maps (and other heat map types), including: Quotes from LISA'13 yesterday:
Background: Frame Merging • When zoomed out, stacks appear as narrow stripes • Adjacent identical functions can be merged to improve readability, eg: mu... mu... ge... muex_tryl... ge... mu... mu... mu... mutex_lock_impl() mu... mu... mu... mutex_lock() ke... ke... ke... key_cache_read() • This sometimes works: eg, a repetitive single threaded app • Often does not (previous slide already did this), due to code execution between samples or parallel thread execution
Background: Frame Merging • Time-series ordering isn’t necessary for the primary use case: identify the most common (“hottest”) code path or paths • By using a different x-axis sort order, frame merging can be greatly improved...
Flame Graphs
Flame Graphs • Flame Graphs sort stacks alphabetically. This sort is applied from the bottom frame upwards. This increases merging and visualizes code paths. Stack Depth Alphabet
Flame Graphs: Definition • Each box represents a function (a merged stack frame) • y-axis shows stack depth • top function led directly to the profiling event • everything beneath it is ancestry (explains why) • x-axis spans the sample population, sorted alphabetically • Box width is proportional to the total time a function was profiled directly or its children were profiled • All threads can be shown in the same Flame Graph (the default), or as separate per-thread Flame Graphs • Flame Graphs can be interactive: mouse over for details
Flame Graphs: Variations • Profile data can be anything: CPU, I/O, memory, ... • Naming suggestion: [event] [units] Flame Graph • Eg: "FS Latency Flame Graph" • By default, Flame Graphs == CPU Sample Flame Graphs • Colors can be used for another dimension • by default, random colors are used to differentiate boxes • --hash for hash-based on function name • Distribution applications can be shown in the same Flame Graph (merge samples from multiple systems)
Flame Graphs: A Simple Example • A CPU Sample Flame Graph: f() d() e() c() h() b() g() a() • I’ll illustrate how these are read by posing various questions
Flame Graphs: How to Read • A CPU Sample Flame Graph: f() d() e() c() h() b() g() a() • Q: which function is on-CPU the most?
Flame Graphs: How to Read • A CPU Sample Flame Graph: top edge shows who is on-CPU directly f() d() e() c() h() b() g() a() • Q: which function is on-CPU the most? • A: f() e() is on-CPU a little, but its runtime is mostly spent in f() , which is on-CPU directly
Flame Graphs: How to Read • A CPU Sample Flame Graph: f() d() e() c() h() b() g() a() • Q: why is f() on-CPU?
Flame Graphs: How to Read • A CPU Sample Flame Graph: f() was called by e() e() was called by c() ... f() ancestry d() e() c() h() b() g() a() • Q: why is f() on-CPU? • A: a() → b() → c() → e() → f()
Flame Graphs: How to Read • A CPU Sample Flame Graph: f() d() e() c() h() b() g() a() • Q: how does b() compare to g() ?
Flame Graphs: How to Read • A CPU Sample Flame Graph: visually compare lengths f() d() e() c() h() b() g() a() • Q: how does b() compare to g() ? • A: b() looks like it is running (present) about 10 times more often than g()
Flame Graphs: How to Read • A CPU Sample Flame Graph: ... or mouse over f() d() e() c() h() status line or tool tip: b() g() b() is 90% a() • Q: how does b() compare to g() ? • A: for interactive Flame Graphs, mouse over shows b() is 90%, g() is 10%
Flame Graphs: How to Read • A CPU Sample Flame Graph: ... or mouse over f() d() e() c() h() status line or tool tip: b() g() g() is 10% a() • Q: how does b() compare to g() ? • A: for interactive Flame Graphs, mouse over shows b() is 90%, g() is 10%
Flame Graphs: How to Read • A CPU Sample Flame Graph: f() d() e() c() h() b() g() a() • Q: why are we running f() ?
Flame Graphs: How to Read • A CPU Sample Flame Graph: look for branches f() d() e() c() h() b() g() a() • Q: why are we running f() ? • A: code path branches can reveal key functions: • a() choose the b() path • c() choose the e() path
Flame Graphs: Example 1 • Customer alerting software periodically checks a log, however, it is taking too long (minutes). • It includes grep(1) of an ~18 Mbyte log file, which takes around 10 minutes! • grep(1) appears to be on-CPU for this time. Why?
Flame Graphs: Example 1 • CPU Sample Flame Graph for grep(1) user-level stacks:
Flame Graphs: Example 1 • CPU Sample Flame Graph for grep(1) user-level stacks: UTF8? • 82% of samples are in check_multibyte_string() or its children. This seems odd as the log file is plain ASCII. • And why is UTF8 on the scene? ... Oh, LANG=en_US.UTF-8
Flame Graphs: Example 1 • CPU Sample Flame Graph for grep(1) user-level stacks: UTF8? • Switching to LANG=C improved performance by 2000x • A simple example, but I did spot this from the raw profiler text before the Flame Graph. You really need Flame Graphs when the text gets too long and unwieldy.
Flame Graphs: Example 2 • A potential customer benchmarks disk I/O on a cloud instance. The performance is not as fast as hoped. • The host has new hardware and software. Issues with the new type of disks is suspected.
Flame Graphs: Example 2 • A potential customer benchmarks disk I/O on a cloud instance. The performance is not as fast as hoped. • The host has new hardware and software. Issues with the new type of disks is suspected. • I take a look, and notice CPU time in the kernel is modest. • I’d normally assume this was I/O overheads and not profile it yet, instead beginning with I/O latency analysis. • But Flame Graphs make it easy, and it may be useful to see what code paths (illumos kernel) are on the table.
Flame Graphs: Example 2
Flame Graphs: Example 2 • 24% in tsc_read()? Time Stamp Counter? Checking ancestry...
Flame Graphs: Example 2 • 62% in zfs_zone_io_throttle? Oh, we had forgotten that this new platform had ZFS I/O throttles turned on by default!
Flame Graphs: Example 3 • Application performance is about half that of a competitor • Everything is believed identical (H/W, application, config, workload) except for the OS and kernel • Application is CPU busy, nearly 100% in user-mode. How can the kernel cause a 2x delta when the app isn't in kernel-mode? • Flame graphs on both platforms for user-mode were created: • Linux, using perf • SmartOS, using DTrace • Added flamegraph.pl --hash option for consistent function colors (not random), aiding comparisons
Flame Graphs: Example 3 Extra Function: UnzipDocid() Linux SmartOS • Function label formats are different, but that's just due to different profilers/stackcollapse.pl's (should fix this) • Widths slighly different, but we already know perf differs • Extra function? This is executing different application software! SphDocID_t UnzipDocid () { return UnzipOffset(); } • Actually, a different compiler option was eliding this function
Flame Graphs: More Examples • Flame Graphs are typically more detailed, like the earlier MySQL example • Next, how to generate them, then more examples
Generation
Generation • I’ll describe the original Perl version I wrote and shared on github: • https://github.com/brendangregg/FlameGraph • There are other great Flame Graph implementations with different features and usage, which I’ll cover in the last section
Generation: Steps • 1. Profile event of interest • 2. stackcollapse.pl • 3. flamegraph.pl
Generation: Overview • Full command line example. This uses DTrace for CPU profiling of the kernel: # dtrace -x stackframes=100 -n 'profile-997 /arg0/ { @[stack()] = count(); } tick-60s { exit(0); }' -o out.stacks # stackcollapse.pl < out.stacks > out.folded # flamegraph.pl < out.folded > out.svg • Then, open out.svg in a browser • Intermediate files could be avoided (piping), but they can be handy for some manual processing if needed (eg, using vi)
Generation: Profiling Data • The profile data, at a minimum, is a series of stack traces • These can also include stack trace counts. Eg: mysqld`_Z13add_to_statusP17system_status_varS0_+0x47 mysqld`_Z22calc_sum_of_all_statusP17system_status_var+0x67 mysqld`_Z16dispatch_command19enum_server_commandP3THDPcj+0x1222 mysqld`_Z10do_commandP3THD+0x198 mysqld`handle_one_connection+0x1a6 libc.so.1`_thrp_setup+0x8d libc.so.1`_lwp_start # of occurrences for this stack 5530 • This example is from DTrace, which prints a series of these. The format of each group is: stack, count, newline • Your profiler needs to print full (not truncated) stacks, with symbols. This may be step 0: get the profiler to work!
Generation: Profiling Tools • Solaris/FreeBSD/SmartOS/...: • DTrace • Linux: • perf, SystemTap • OS X: • Instruments • Windows: • Xperf.exe
Generation: Profiling Examples: DTrace • CPU profile kernel stacks at 997 Hertz, for 60 secs: # dtrace -x stackframes=100 -n 'profile-997 /arg0/ { @[stack()] = count(); } tick-60s { exit(0); }' -o out.kern_stacks • CPU profile user-level stacks for PID 12345 at 99 Hertz, 60s: # dtrace -x ustackframes=100 -n 'profile-97 /PID == 12345 && arg1/ { @[ustack()] = count(); } tick-60s { exit(0); }' -o out.user_stacks • Should also work on Mac OS X, but is pending some fixes preventing stack walking (use Instruments instead) • Should work for Linux one day with the DTrace ports
Generation: Profiling Examples: perf • CPU profile full stacks at 97 Hertz, for 60 secs: # perf record -a -g -F 97 sleep 60 # perf script > out.stacks • Need debug symbol packages installed (*dbgsym), otherwise stack frames may show as hexidecimal • May need compilers to cooperate (-fno-omit-frame-pointer) • Has both user and kernel stacks, and the kernel idle thread. Can filter the idle thread after stackcollapse-perf.pl using: # stackcollapse-perf.pl < out.stacks | grep -v cpu_idle | ...
Generation: Profiling Examples: SystemTap • CPU profile kernel stacks at 100 Hertz, for 60 secs: # stap -s 32 -D MAXTRACE=100 -D MAXSTRINGLEN=4096 -D MAXMAPENTRIES=10240 \ -D MAXACTION=10000 -D STP_OVERLOAD_THRESHOLD=5000000000 --all-modules \ -ve 'global s; probe timer.profile { s[backtrace()] <<< 1; } probe end { foreach (i in s+) { print_stack(i); printf("\t%d\n", @count(s[i])); } } probe timer.s(60) { exit(); }' \ > out.kern_stacks • Need debug symbol packages installed (*dbgsym), otherwise stack frames may show as hexidecimal • May need compilers to cooperate (-fno-omit-frame-pointer)
Generation: Dynamic Languages • C or C++ are usually easy to profile, runtime environments (JVM, node.js, ...) are usually not, typically a way to show program stacks and not just runtime internals. • Eg, DTrace’s ustack helper for node.js: 0xfc618bc0 libc.so.1`gettimeofday+0x7 0xfc61bd62 Date at position 0xfe870841 << adaptor >> 0xfc61c1f3 << constructor >> 0xfc617685 (anon) as exports.active at timers.js position 7590 0xfe870841 (anon) as Socket._write at net.js position 21336 0xfc6154d7 (anon) as Socket.write at net.js position 19714 0xfe870e1a << adaptor >> [...] (anon) as OutgoingMessage._writeRaw at http.js p... (anon) as OutgoingMessage._send at http.js posit... << adaptor >> (anon) as OutgoingMessage.end at http.js pos... [...] http://dtrace.org/blogs/dap/2012/01/05/where-does-your-node-program-spend-its-time/
Generation: stackcollapse.pl • Converts profile data into a single line records • Variants exist for DTrace, perf, SystemTap, Instruments, Xperf • Eg, DTrace: unix`i86_mwait+0xd unix`cpu_idle_mwait+0xf1 unix`idle+0x114 unix`thread_start+0x8 19486 # stackcollapse.pl < out.stacks > out.folded unix`thread_start;unix`idle;unix`cpu_idle_mwait;unix`i86_mwait 19486
Generation: stackcollapse.pl • Converts profile data into a single line records • Variants exist for DTrace, perf, SystemTap, Instruments, Xperf • Eg, DTrace: unix`i86_mwait+0xd unix`cpu_idle_mwait+0xf1 unix`idle+0x114 unix`thread_start+0x8 19486 # stackcollapse.pl < out.stacks > out.folded unix`thread_start;unix`idle;unix`cpu_idle_mwait;unix`i86_mwait 19486 stack trace, frames are ‘;’ delimited count
Generation: stackcollapse.pl • Full output is many lines, one line per stack • Bonus: can be grepped # ./stackcollapse-stap.pl out.stacks | grep ext4fs_dirhash system_call_fastpath;sys_getdents;vfs_readdir;ext4_readdir;ext4_htree_fill_ tree;htree_dirblock_to_tree;ext4fs_dirhash 100 system_call_fastpath;sys_getdents;vfs_readdir;ext4_readdir;ext4_htree_fill_ tree;htree_dirblock_to_tree;ext4fs_dirhash;half_md4_transform 505 system_call_fastpath;sys_getdents;vfs_readdir;ext4_readdir;ext4_htree_fill_ tree;htree_dirblock_to_tree;ext4fs_dirhash;str2hashbuf_signed 353 [...] • That shows all stacks containing ext4fs_dirhash(); useful debug aid by itself • grep can also be used to filter stacks before Flame Graphs • eg: grep -v cpu_idle
Generation: Final Output • Desires: • Full control of output • High density detail • Portable: easily viewable • Interactive
Generation: Final Output • Desires: • Full control of output • High density detail PNG SVG+JS • Portable: easily viewable • Interactive • SVG+JS: Scalable Vector Graphics with embedded JavaScript • Common standards, and supported by web browsers • Can print poster size (scalable); but loses interactivity! • Can be emitted by a simple Perl program...
Generation: flamegraph.pl • Converts folded stacks into an interactive SVG. Eg: # flamegraph.pl --titletext="Flame Graph: MySQL" out.folded > graph.svg • Options: change the title text (default is “Flame Graph”) --titletext width of image (default is 1200) --width height of each frame (default is 16) --height omit functions smaller than this width (default is 0.1 pixels) --minwidth font type (default “Verdana”) --fonttype font size (default 12) --fontsize count type label (default “samples”) --countname name type label (default “Function:”) --nametype color palette: "hot", "mem", "io" --colors colors are keyed by function name hash --hash
Types
Types • CPU • Memory • Off-CPU • More
CPU
CPU • Measure code paths that consume CPU • Helps us understand and optimize CPU usage, improving performance and scalability • Commonly performed by sampling CPU stack traces at a timed interval (eg, 100 Hertz for every 10 ms), on all CPUs • DTrace/perf/SystemTap examples shown earlier • Can also be performed by tracing function execution
CPU: Sampling CPU stack sampling: A A A B - - - - B A A A A A A( ) B( ) user-level syscall kernel On-CPU X O ff -CPU block . . . . . . . . . interrupt
CPU: Tracing CPU function tracing: A( B( B) A) A( ) B( ) user-level syscall kernel On-CPU X O ff -CPU block . . . . . . . . . interrupt
CPU: Profiling • Sampling: • Coarse but usually effective • Can also be low overhead, depending on the stack type and sample rate, which is fixed (eg, 100 Hz x CPU count) • Tracing: • Overheads can be too high, distorting results and hurting the target (eg, millions of trace events per second) • Most Flame Graphs are generated using stack sampling
CPU: Profiling Results • Example results. Could you do this? As an experiment to investigate the performance of the resulting TCP/IP implementation ... the 11/750 is CPU saturated, but the 11/780 has about 30% idle time. The time spent in the system processing the data is spread out among handling for the Ethernet (20%), IP packet processing (10%), TCP processing (30%), checksumming (25%), and user system call handling (15%), with no single part of the handling dominating the time in the system.
CPU: Profiling Results • Example results. Could you do this? As an experiment to investigate the performance of the resulting TCP/IP implementation ... the 11/750 is CPU saturated, but the 11/780 has about 30% idle time. The time spent in the system processing the data is spread out among handling for the Ethernet (20%), IP packet processing (10%), TCP processing (30%), checksumming (25%), and user system call handling (15%), with no single part of the handling dominating the time in the system. – Bill Joy, 1981 , TCP-IP Digest, Vol 1 #6 • An impressive report, that even today would be difficult to do • Flame Graphs make this a lot easier
CPU: Another Example • A file system is archived using tar(1). • The files and directories are cached, and the run time is mostly on-CPU in the kernel (Linux). Where exactly?
CPU: Another Example
CPU: Another Example • 20% for reading directories
CPU: Another Example • 54% for file statistics
CPU: Another Example • Also good for learning kernel internals: browse the active code
CPU: Recognition • Once you start profiling a target, you begin to recognize the common stacks and patterns • Linux getdents() ext4 path: • The next slides show similar example kernel-mode CPU Sample Flame Graphs
CPU: Recognition: illumos localhost TCP • From a TCP localhost latency issue (illumos kernel): illumos fused-TCP illumos send fused-TCP receive
CPU: Recognition: illumos IP DCE issue DCE lookup DCE lookup DCE lookup
CPU: Recognition: Linux TCP send • Profiled from a KVM guest: Linux TCP sendmsg
CPU: Recognition: Syscall Towers
CPU: Recognition: Syscall Towers lstat() sendfile() bnx open() writev() bnx ip fanout xmit recv receive close() pollsys() read() write() stat() stat64()
CPU: Both Stacks • Apart from showing either user- or kernel-level stacks, both can be included by stacking kernel on top of user • Linux perf does this by default • DTrace can by aggregating @[stack(), ustack()] • The different stacks can be highlighted in different ways: • different colors or hues • separator: flamegraph.pl will color gray any functions called "-", which can be inserted as stack separators • Kernel stacks are only present during syscalls or interrupts
CPU: Both Stacks Example: KVM/qemu user only kernel user stack stack
Advanced Flame Graphs
Other Targets • Apart from CPU samples, stack traces can be collected for any event; eg: • disk, network, or FS I/O • CPU events, including cache misses • lock contention and holds • memory allocation • Other values, instead of sample counts, can also be used: • latency • bytes • The next sections demonstrate memory allocation, I/O tracing, and then all blocking types via off-CPU tracing
Recommend
More recommend
Explore More Topics
Stay informed with curated content and fresh updates.
