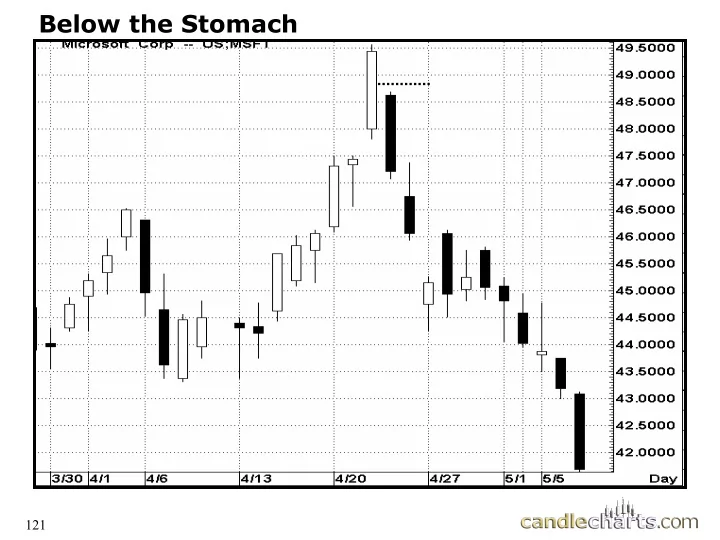

Below the Stomach 121
Counter Attack Lines close close Bearish Bullish Bearish Bullish 122
Not Counter Attack Lines Second session did not open high enough Both sessions were not long real bodies 123
Bullish Counter Attack 124
Volume – Counter Attack 125
Bullish Counter-attack First sign of a turn was bullish counter- attack 126
Convergence of Clues- Counter Attack Bearish counter Bearish engulfing attack pattern doji 127
Bearish Counter-attack Counter- attack also confirming resistance Why does this candle hint bears’ are not in complete control in spite of the large price drop? What happened the next session? 128
The “Phantom” method The “Phantom” method What was support before this session? 129 129
Phantom method Phantom method 130
Phantom Phantom 131
Phantom method – – where’s R1? where’s R1? (slide 1 of 2) Phantom method (slide 1 of 2) 132
Phantom method (slide 2 of 2) Phantom method (slide 2 of 2) 133
Using Candles in a “Box” Range 134
Box range Box range Do the bears or bulls have the greater control? 135
Box Range Box Range Do the bears or bulls have the greater control? 136
Intraday Techniques Intraday Techniques Intraday Techniques Intraday Techniques � Flexibility reading candle signals � Combining intraday signals with longer time frame support or resistance. � Harnessing intraday charts for signals not available on daily charts 137
Bearish engulfing pattern and Intraday charts We are less strict with the definition of some patterns on intra-day charts. Classic bearish engulfing pattern has open above prior session close. With intraday open can = prior close. 138
Intra-day candle patterns Although open and al close are the same, view this as dark cloud Bullish engulfing pattern Open and closings are about the same, still view this as a morning star 139
Windows on intraday Most intraday windows will be between the last candle yesterday and the first candle today 140
Recommend
More recommend