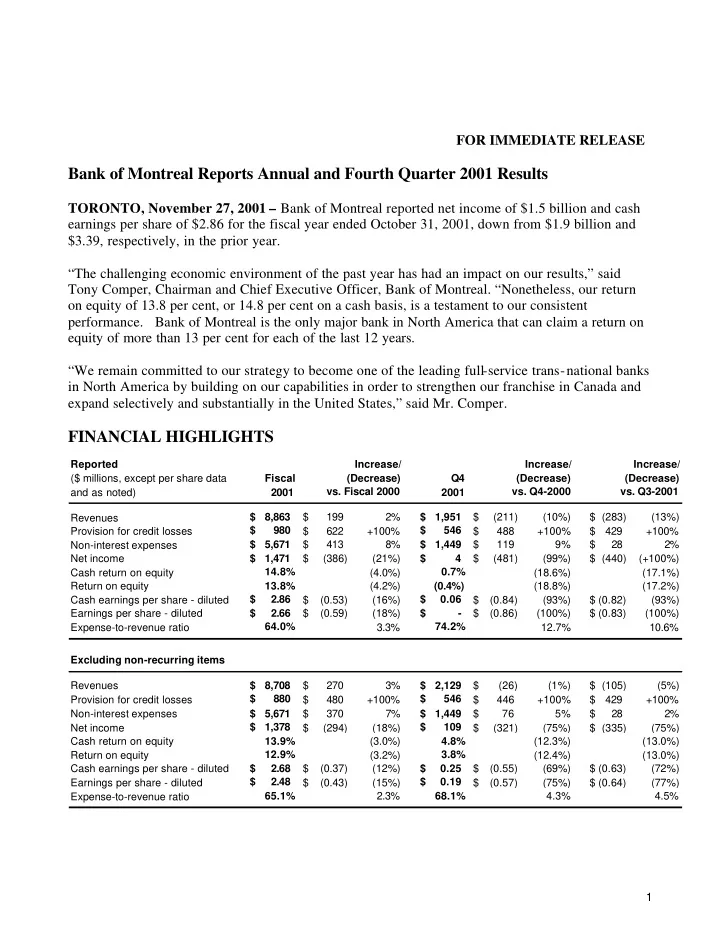

FOR IMMEDIATE RELEASE Bank of Montreal Reports Annual and Fourth Quarter 2001 Results TORONTO, November 27, 2001 – Bank of Montreal reported net income of $1.5 billion and cash earnings per share of $2.86 for the fiscal year ended October 31, 2001, down from $1.9 billion and $3.39, respectively, in the prior year. “The challenging economic environment of the past year has had an impact on our results,” said Tony Comper, Chairman and Chief Executive Officer, Bank of Montreal. “Nonetheless, our return on equity of 13.8 per cent, or 14.8 per cent on a cash basis, is a testament to our consistent performance. Bank of Montreal is the only major bank in North America that can claim a return on equity of more than 13 per cent for each of the last 12 years. “We remain committed to our strategy to become one of the leading full-service trans-national banks in North America by building on our capabilities in order to strengthen our franchise in Canada and expand selectively and substantially in the United States,” said Mr. Comper. FINANCIAL HIGHLIGHTS Reported Increase/ Increase/ Increase/ ($ millions, except per share data Fiscal (Decrease) Q4 (Decrease) (Decrease) vs. Fiscal 2000 vs. Q4-2000 vs. Q3-2001 and as noted) 2001 2001 $ 8,863 $ 199 2% $ 1,951 $ (211) (10%) $ (283) (13%) Revenues $ 980 $ 546 Provision for credit losses $ 622 +100% $ 488 +100% $ 429 +100% $ 5,671 $ 413 8% $ 1,449 $ 119 9% $ 28 2% Non-interest expenses Net income $ 1,471 $ (386) (21%) $ 4 $ (481) (99%) $ (440) (+100%) Cash return on equity 14.8% (4.0%) 0.7% (18.6%) (17.1%) Return on equity 13.8% (4.2%) (0.4%) (18.8%) (17.2%) $ 2.86 $ 0.06 Cash earnings per share - diluted $ (0.53) (16%) $ (0.84) (93%) $ (0.82) (93%) Earnings per share - diluted $ 2.66 $ (0.59) (18%) $ - $ (0.86) (100%) $ (0.83) (100%) 64.0% 74.2% Expense-to-revenue ratio 3.3% 12.7% 10.6% Excluding non-recurring items Revenues $ 8,708 $ 270 3% $ 2,129 $ (26) (1%) $ (105) (5%) Provision for credit losses $ 880 $ 480 +100% $ 546 $ 446 +100% $ 429 +100% Non-interest expenses $ 5,671 $ 370 7% $ 1,449 $ 76 5% $ 28 2% Net income $ 1,378 $ (294) (18%) $ 109 $ (321) (75%) $ (335) (75%) Cash return on equity 13.9% (3.0%) 4.8% (12.3%) (13.0%) 12.9% 3.8% Return on equity (3.2%) (12.4%) (13.0%) Cash earnings per share - diluted $ 2.68 $ (0.37) (12%) $ 0.25 $ (0.55) (69%) $ (0.63) (72%) $ 2.48 $ 0.19 Earnings per share - diluted $ (0.43) (15%) $ (0.57) (75%) $ (0.64) (77%) 65.1% 2.3% 68.1% 4.3% 4.5% Expense-to-revenue ratio 1
The weakening of the economy, accelerated by the tragic events of September 11, prompted the Bank to announce higher provisions for credit losses and write-downs totalling $682 million or $414 million after-tax in the fourth quarter of 2001. These charges caused net income to decline year- over-year and resulted in earnings, excluding non-recurring items, falling to $109 million in the quarter. Excluding the higher provisions and write-downs referred to above, cash earnings per share increased by seven per cent from fiscal 2000 and cash return on equity was 16.9 per cent, excluding non- recurring items. These results were in line with the guidance provided by the Bank following the release of third quarter results, but were below the annual targets established at the beginning of the year. Excluding non-recurring items, Personal and Commercial Client Group net income for 2001 was slightly lower than in 2000, reflecting low revenue growth in the first half of the year, which was affected by implementing initiatives related to the Bank’s longer-term growth strategies. Sales momentum improved in the second half of the year, but results were affected by lower net interest margins in the declining interest rate environment. Investment Banking Group was most affected by the higher provisions and write-downs announced in the fourth quarter and its results fell year-over-year as a result. Otherwise, net income rose strongly, driven by significantly improved results from fixed income businesses, which benefited from the low interest rate environment this year. While earnings from other core high-return businesses declined from the record performances of 2000, results continue to reflect leadership positions in equities, mergers and acquisitions, securitizations and research. Private Client Group continued to execute its strategy of expanding its distribution capabilities. Results fell year-over-year due to challenging market conditions, but the Group is well positioned to benefit from a return to more active equity markets. Fiscal 2001 Compared with Fiscal 2000 Excluding non-recurring items, cash earnings per share were $2.68, down 12 per cent from fiscal 2000. Excluding non-recurring items, net income of $1.38 billion fell by 18 per cent. Non-recurring items are defined and their effects by period are detailed on page 13. Excluding non-recurring items, the provision for credit losses increased by $480 million in 2001. Excluding non-recurring items and the after-tax effect of the higher provisions for credit losses, net income in 2001 was substantially unchanged from the prior year. The charges that were announced in the quarter included additional provisions for credit losses totalling $430 million ($265 million after-tax), of which approximately $260 million related to U.S. loans. Investment Banking Group absorbed $314 million ($188 million after-tax) of the increase, while Personal and Commercial Client Group absorbed $19 million ($11 million after-tax). Provisions in Corporate Support increased $97 million ($66 million after-tax). The remainder of the announced charges related to write-downs totalling $252 million ($149 million after-tax). The most significant item was a $178 million ($105 million after-tax) write-down related to the Investment Banking Group’s equity investments in its own collateralized bond obligations (CBOs), which was categorized as a non-recurring item for reporting purposes. Amounts also 2
Recommend
More recommend