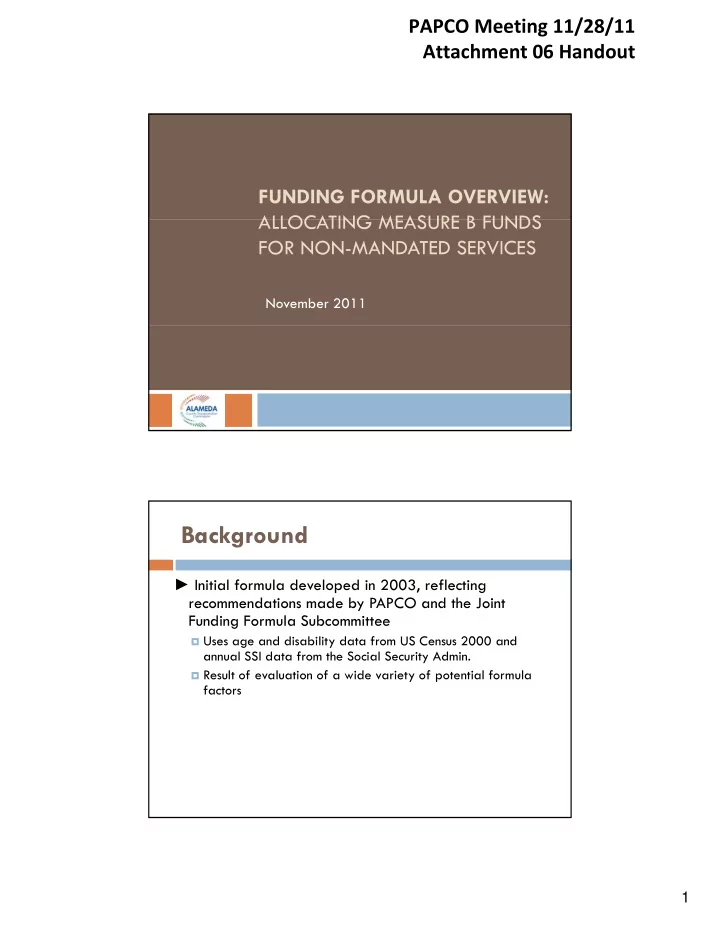

PAPCO Meeting 11/28/11 Attachment 06 Handout FUNDING FORMULA OVERVIEW: ALLOCATING MEASURE B FUNDS ALLOCATING MEASURE B FUNDS FOR NON-MANDATED SERVICES November 2011 Background ► Initial formula developed in 2003, reflecting recommendations made by PAPCO and the Joint recommendations made by PAPCO and the Joint Funding Formula Subcommittee � Uses age and disability data from US Census 2000 and annual SSI data from the Social Security Admin. � Result of evaluation of a wide variety of potential formula factors 1
11/28/2011 Background ► Minor changes made to funding formula in 2007 and 2008 2008 � Weighting and SSI data ► Current formula expires in 2012 � In 2008, both Committees decided to evaluate available data sources in 2011 (Census 2010, American Community Survey) Givens of the Formula ► The following is included in the Expenditure Plan and cannot be changed and cannot be changed: Of the total revenue collected from Measure B: � 10.45% go to specialized transportation for seniors and people with disabilities � 5.63% goes to mandated paratransit services � 3 39% goes to non mandated paratransit services � 3.39% goes to non-mandated paratransit services � 1.43% goes to Gap Program 2
11/28/2011 Givens of the Formula ► Percent of funds for non-mandated paratransit services allocated to each Planning Area services allocated to each Planning Area: � North County = 1.24% � Central County = .88% = 3.39% � South County = 1.06% � East County = .21% Expenditure Plan ► “ Funds are also provided for non-mandated services, aimed at improving mobility for seniors and people with aimed at improving mobility for seniors and people with disabilities. These funds are provided to the cities in the County and to Alameda County based on a formula developed by PAPCO. ” 3
11/28/2011 Givens of the Formula ► Funds from each planning area may not be p g y transferred into another area ► PAPCO formula allocates funding ONLY within each planning area PAPCO Formula: How is funding allocated? (A hypothetical example) ► Planning Area – Disneyland � Adventureland � Fantasyland � Frontierland � Tomorrowland City Zip Codes Adventureland 11111 Fantasyland 22222, 33333 Frontierland 44444 Tomorrowland 55555, 66666 4
11/28/2011 How is funding allocated? – Step 1 ► One factor: Seniors 65+ � Collect census data per zip code C ll d i d Zip Code # of Seniors 65+ 11111 20 22222 30 33333 20 44444 40 55555 10 66666 30 Total 150 How is funding allocated? – Step 2 ► Apply data per zip code to “Cities” � Determine each Cities’ percentage of the Planning D i h Ci i ’ f h Pl i Area total City Zip Codes 65+ per City % City of PA Adventureland 11111 20 13.3% Fantasyland 22222, 33333 50 33.3% Frontierland Frontierland 44444 44444 40 40 26 6% 26.6% Tomorrowland 55555, 66666 40 26.6% Total 150 100% 5
11/28/2011 How is funding allocated? – Step 3 ► What is the projected annual allocation? � $10,000 for the Disneyland Planning Area, distribute $10 000 f h Di l d Pl i A di ib via percentage to each City City 65+ per City % City of PA City Allocation Adventureland 20 13.3% $1,330 Fantasyland 50 33.3% $3,330 Frontierland 40 26.6% $2,660 $ Tomorrowland 40 26.6% $2,660 Total 150 100% $10,000 Current Funding Formula Factors ► Individuals 5-15 with any type of disability ► Individuals 16+ with go-outside-home disability ► Individuals 16+ with go outside home disability * ► Individuals 65-79 ► Individuals 80+ � Multiplied by 1.5, given that many individuals over 80 have disabilities, and therefore have greater need for paratransit services ► SSI recipients 18 and older � Held constant since 2006 * Individual has a physical, mental, or emotional condition lasting 6 months or more that makes it difficult to go outside the home alone (e.g. to shop or visit a doctor's office) 6
11/28/2011 Questions for Discussion ► Funding Formula Factors: Do age, income and disability continue to be the issues that should be y addressed in the formula? ► Data Sources: Is there sufficient data available to measure each of these factors? � Since there is not an accurate and reliable data source for disability, can age be used as a surrogate? g � Since SSI data is no longer available, should income be included as a measure separate from disability? Questions for Discussion ► Allocation to the Planning Area: Should a portion of funds be allocated for optional use at portion of funds be allocated for optional use at the planning area level? � Is there support for this concept? � If so, should money be taken “off the top” to fund planning-area level programs and the balance distributed to city programs? distributed to city programs? � Should this be optional or mandatory? 7
11/28/2011 TABLE FOR DATA TABLE FOR DATA DISCUSSION Disability Data (Average ACS 1-Year Estimates, 2005-1010) Population with % Planning Area Population with % Planning Area Disability Total Disability Total Fremont 16,974 74% Alameda 7,194 11% Newark - - Albany - - Berkeley 10,293 15% Union City 6,062 26% Emeryville - - SOUTH COUNTY 23,036 100% Oakland 49,868 74% Sunol - - Piedmont - - Pleasanton 5,147 42% Oakland TOTAL 49,868 74% Pleasanton TOTAL 5,147 42% NORTH COUNTY 67,355 100% Dublin - - Hayward 14,599 63% Livermore Livermore 7 181 7,181 58% 58% Ashland - - LAVTA TOTAL 7,181 58% Cherryland - - EAST COUNTY 12,329 100% Castro Valley - - Fairview - - San Lorenzo - - Hayward TOTAL 14,599 63% San Leandro 8,753 37% CENTRAL COUNTY 23,352 100% 8
Recommend
More recommend