Autoregressive Models Autoregressive Models In [1]: from mxnet - PowerPoint PPT Presentation
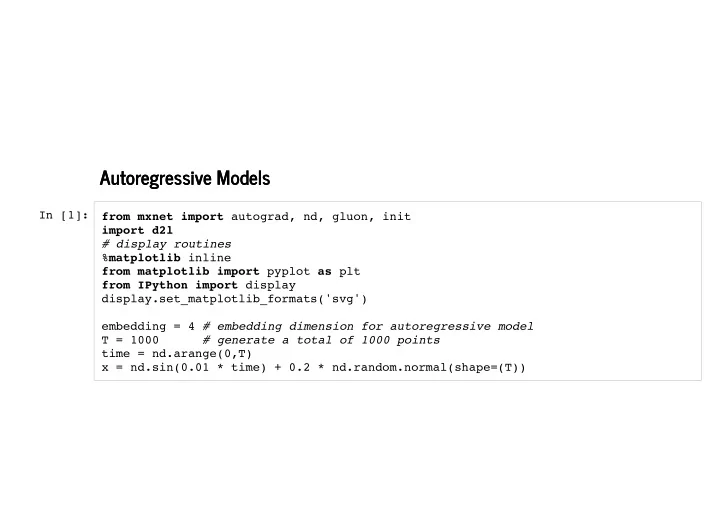
4/3/2019 sequence slides Autoregressive Models Autoregressive Models In [1]: from mxnet import autograd, nd, gluon, init import d2l # display routines % matplotlib inline from matplotlib import pyplot as plt from IPython import display
4/3/2019 sequence slides Autoregressive Models Autoregressive Models In [1]: from mxnet import autograd, nd, gluon, init import d2l # display routines % matplotlib inline from matplotlib import pyplot as plt from IPython import display display.set_matplotlib_formats('svg') embedding = 4 # embedding dimension for autoregressive model T = 1000 # generate a total of 1000 points time = nd.arange(0,T) x = nd.sin(0.01 * time) + 0.2 * nd.random.normal(shape=(T)) 127.0.0.1:8000/sequence.slides.html?print-pdf/#/ 1/8
4/3/2019 sequence slides In [2]: plt.plot(time.asnumpy(), x.asnumpy()); 127.0.0.1:8000/sequence.slides.html?print-pdf/#/ 2/8
4/3/2019 sequence slides Generating the Regression Dataset Generating the Regression Dataset In [3]: features = nd.zeros((T-embedding, embedding)) for i in range(embedding): features[:,i] = x[i:T-embedding+i] labels = x[embedding:] ntrain = 600 train_data = gluon.data.ArrayDataset(features[:ntrain,:], labels[:ntrain]) test_data = gluon.data.ArrayDataset(features[ntrain:,:], labels[ntrain:]) def get_net(): net = gluon.nn.Sequential() net.add(gluon.nn.Dense(10, activation='relu')) net.add(gluon.nn.Dense(10, activation='relu')) net.add(gluon.nn.Dense(1)) net.initialize(init.Xavier()) return net loss = gluon.loss.L2Loss() 127.0.0.1:8000/sequence.slides.html?print-pdf/#/ 3/8
4/3/2019 sequence slides Training Training In [4]: # simple optimizer using adam, random shuffle and minibatch size 16 def train_net(net, data, loss, epochs, learningrate): batch_size = 16 trainer = gluon.Trainer(net.collect_params(), 'adam', {'learning_rate': learni ngrate}) data_iter = gluon.data.DataLoader(data, batch_size, shuffle= True ) for epoch in range(1, epochs + 1): for X, y in data_iter: with autograd.record(): l = loss(net(X), y) l.backward() trainer.step(batch_size) l = loss(net(data[:][0]), nd.array(data[:][1])) print('epoch %d , loss: %f ' % (epoch, l.mean().asnumpy())) return net 127.0.0.1:8000/sequence.slides.html?print-pdf/#/ 4/8
4/3/2019 sequence slides In [5]: net = get_net() net = train_net(net, train_data, loss, 10, 0.01) l = loss(net(test_data[:][0]), nd.array(test_data[:][1])) print('test loss: %f ' % l.mean().asnumpy()) epoch 1, loss: 0.034819 epoch 2, loss: 0.030474 epoch 3, loss: 0.030604 epoch 4, loss: 0.028803 epoch 5, loss: 0.028788 epoch 6, loss: 0.028255 epoch 7, loss: 0.030694 epoch 8, loss: 0.027550 epoch 9, loss: 0.027518 epoch 10, loss: 0.026951 test loss: 0.024539 127.0.0.1:8000/sequence.slides.html?print-pdf/#/ 5/8
4/3/2019 sequence slides Results Results In [6]: estimates = net(features) plt.plot(time.asnumpy(), x.asnumpy(), label='data'); plt.plot(time[embedding:].asnumpy(), estimates.asnumpy(), label='estimate'); plt.legend(); 127.0.0.1:8000/sequence.slides.html?print-pdf/#/ 6/8
4/3/2019 sequence slides Predictions for more than 1 step Predictions for more than 1 step In [7]: predictions = nd.zeros_like(estimates) predictions[:(ntrain-embedding)] = estimates[:(ntrain-embedding)] for i in range(ntrain-embedding, T-embedding): predictions[i] = net(predictions[(i-embedding):i].reshape(1,-1)).reshape(1) plt.plot(time.asnumpy(), x.asnumpy(), label='data'); plt.plot(time[embedding:].asnumpy(), estimates.asnumpy(), label='estimate'); plt.plot(time[embedding:].asnumpy(), predictions.asnumpy(), label='multistep'); plt.legend(); 127.0.0.1:8000/sequence.slides.html?print-pdf/#/ 7/8
4/3/2019 sequence slides In [8]: k = 33 # look up to k - embedding steps ahead features = nd.zeros((T-k, k)) for i in range(embedding): features[:,i] = x[i:T-k+i] for i in range(embedding, k): features[:,i] = net(features[:,(i-embedding):i]).reshape((-1)) for i in (4, 8, 16, 32): plt.plot(time[i:T-k+i].asnumpy(), features[:,i].asnumpy(), label=('step ' + st r(i))) plt.legend(); 127.0.0.1:8000/sequence.slides.html?print-pdf/#/ 8/8
Recommend


More recommend
Explore More Topics
Stay informed with curated content and fresh updates.