
Arctic sea ice freeboard from ICESat altimetry NASA SNAME Luncheon, October 19 th , 2011 Vidya Renganathan Contractor, Chevron Arctic Center
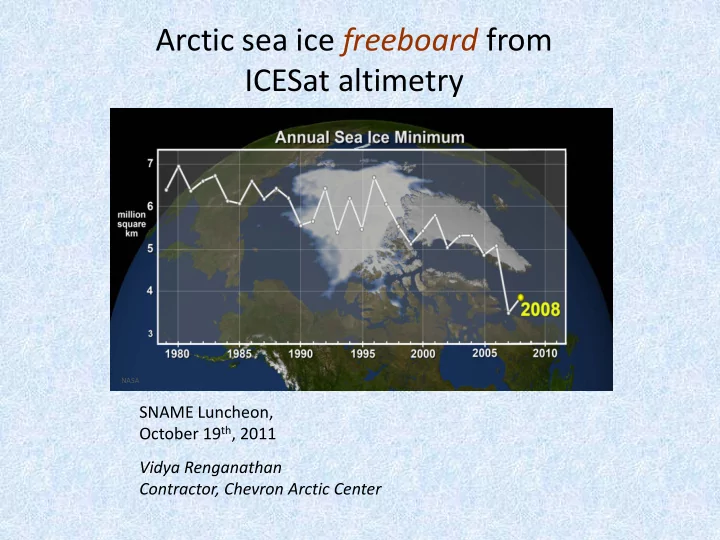
Changing ice conditions What is also important is the ice thickness, its distribution and its inter-annual variability. 2
Why care about sea ice thickness? Quest for natural resources 3
Why care about sea ice thickness? UNEP Chevron Arctic Center Sea routes Ice management 4
Why care about sea ice thickness? Bottom force I ce force 1 0 m 1 Base Friction h Line of excavation 4 Native sand Chevron Arctic Center Ice-structure interaction 5
Research Objective Can ICESat laser altimetry data provide sea ice freeboard and thickness estimates? How do the sea ice freeboards derived in this study compare with other • methods? How do the sea ice thicknesses derived in this study compare with • other methods? What are the magnitudes of uncertainty in the estimated sea ice • freeboard and thickness? 6
Ice Cloud Elevation Satellite – ICESat 7 NASA
Freeboard estimation from ICESat Total Freeboard = snow surface – sea surface Range (Snow) Snow surface = Orbital height – Range (Snow) Chevron Arctic Center 8
Freeboard estimation from ICESat Total Freeboard = snow surface – sea surface Range 1. “Observed” = Orbital height – Range (sea (Snow) surface) Oceanographic models 2. = Geoid + Tides + Mean dynamic topography + inverse barometric effect Chevron Arctic Center 9
Sea surface heights from models Sea surface = Geoid + Tides + Mean Dyn. Topo. + Inv. Barometric Effect Ice freeboard = Snow surface – Sea surface – Snow depth – errors Snow depth Freeboard Tides + Mean Dyn Topo Snow surface Geoid Chevron Arctic Center 10
Geoid, Tides, Mean Dynamic Topography Mean Dyn Topo Tides Geoid UW AOTIM-5 EIGEN-GL04c model Univ. Washington Oregon State Univ. GFZ Germany 11
Comparison with ‘observed sea surface’ method DNSC Feb 2006 ICESat period 12
Validation of ICESat elevations in Churchill Precise leveling – Sep 2006 GPS Real-time Kinematic – Mar 2008 Co-incident field measurements were taken along the predicted ICESat track on the ground 13
Validation of ICESat elevations in Churchill Surface Type ICESat – Precise leveling (m) Surface Type ICESat – GPS RTK (m) Wetlands 0.60 Sea ice < 0.10 Runway 0.20 Boreal forests 0.90 Coast > 1.0 Tidal flats 0.30 14
Sea ice thickness distribution compared to Helicopter Electro-magnetic measurements – May 2006 HEM data: Christian Haas, U of A Two methods agree within 53 cm 15
Sea ice thickness distribution compared to JIP Arctic Islands thickness data (APOA) 16
Summary and Outlook Summary • Freeboard distributions show good agreement with ‘observed’ freeboards • Sea ice thickness shows good agreement with HEM-based thickness estimates and JIP data (APOA) • Sensitivity analysis indicates an error of about 24 cm in freeboard estimates Sensitivity analysis indicates an error of about < 98 cm in thickness estimates • Outlook • Mean Dynamic Topography was the major source of error • The accuracy of this method will improve automatically when the accuracy of the component models continues to improve in the future • An optimal Sea Surface Height estimate can be obtained by combining both ‘observed’ and modeled SSH www.ucalgary.ca/engo_webdocs/AB/10.20301_VRenganathan.pdf 17
2011 studies – Cryosat-2 radar altimeter 18
Questions? 19
Recommend
More recommend