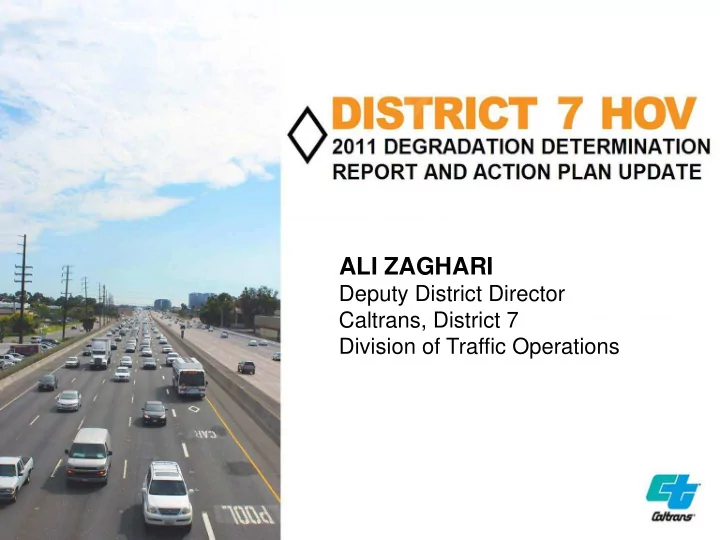

ALI ZAGHARI Deputy District Director Caltrans, District 7 Division of Traffic Operations
Background California law permits ILEV (Inherently Low Emission Vehicles) and previously hybrid vehicles to access HOV lanes Yellow decals – hybrid vehicles – 85,000 decals o – Valid until 07/01/11 Green Decals - plug-in vehicles 40,000 decals o - Valid until 01/01/15 White decals – ILEVs – 19,300 (as of DEC 2011) o – Valid until 01/01/15 Requires performance monitoring and reporting on HOV facilities o that allow single occupancy vehicles (i.e. hybrids and tolled) to access since 2005 As required by Title 23 USC § 166, Caltrans prepared the “2011 California High-Occupancy Vehicle Lane Degradation Determination Report” Analyzes the performance of the HOV network in California o 2
MAP-21 Moving Ahead for Progress in the 21 st Century Enacted on July 6, 2012 Requires State DOTs to remedy degraded HOV/HOT facilities within 180 days Potential sanctions: Loss of Federal funding and project approvals Definition of Degraded Segment: Speed falls below 45 mph during the morning or evening weekday peak hour periods for more than 10% of a 180-day period In other word, an HOV facility is considered degraded if its speed falls below 45 mph for 3 weekdays or more each month 3
Analysis Methodology Traffic collected from in-ground loop detectors, radars, or microwave vehicle detection systems Freeway Performance Measurement System (PeMS) Separated into multiple segments o Each segment = 5 miles maximum o Peak Hour Data (typical statewide peak travel delay) Morning – 8:00 am to 9:00 am o Evening – 5:00 pm to 6:00 pm o Degradation status data include two 180-day periods (weekday data, including weekday holidays) The first 180-day period is Jan. 1, 2011 to June 30, 2011 129 weekdays and 52 weekend days o The second 180-day period is July 1, 2011 to Dec. 31, 2011 131 weekdays and 53 weekend days o 4
Analysis Methodology (Cont.) Caltrans categorized degradation into three classes Slightly degraded o Very degraded o Extremely degraded o Degradation Severity Definitions Percent of 180 days failing to maintain Degradation 45mph for either Morning or Evening Severity peak hours Extremely 75% or higher "Degraded" Degraded Federally Very Degraded 50%-74% Slightly Degraded 10%-49% 5
Analysis Methodology (Cont.) 2011 Statewide HOV Network Degradation Summary First 180-day Period Second 180-day Period July January to June 2011 to December 2011 Total Degraded 43% 49% Not Degraded 57% 51% Morning Peak Hour 20% 23% Degradation 13% slightly Degraded 19% Slightly Degraded Morning Peak Hour 7% Very or Extremely 4% Very or Extremely Severity Degraded Degraded Evening Peak Hour 24% 40% Degradation 19% Slightly Degraded 25% Slightly Degraded Evening Peak Hour 15% Very or Extremly 15% Very or Extremely Severity Degraded Degraded 6
Statewide Degradation Summary by Peak Hour (July 1 - December 31, 2011) Morning only degraded 153.4 lane-miles Morning & evening 12% degraded 141.2 lane-miles 11% Not degraded 669.9 lane-miles 50% Evening only degraded 362.0 lane-miles 27% 7
Statewide Degraded HOV Lane-Miles Summary by District (July 1 - December 31, 2011) 500 450 Degraded Not degraded 400 350 260.3 300 Lane-Miles 179.8 250 200 109.1 150 59.3 100 200.7 187.2 127.6 107.2 50 32.4 15.6 31.7 15.6 0 District 3 District 4 District 7 District 8 District 11 District 12 Note: 1326.5 lane-miles total; numbers may not add up due to rounding 8
District 7 HOV Degradation Map 14
Potential Causes of Degradation Potential Causes Congestion in general purpose (GP) lanes o Weaving conflict at ingress/egress(I/E) locations → congests the HOV lane due to speed differential Lane drops create congestion on the mainline which effects the HOV operation Construction activities o Faulty vehicle detector system o Major Bottlenecks on the mainline o Merging Problems o HOV volume exceeds capacity o HOV violations o 18
Remediation Strategies District 7 Caltrans has been working very closely with FHWA for many years towards understanding the causes and identifying most effective strategies to remedy degradation levels. The proposed Action Plans Strategies were developed by the District with input from Caltrans HQ and FHWA-California Division. Remediation Strategies Short Term Improve mainline operation by removing lane drops through o Restriping More assertive ramp and connector metering operation o In partnership with Metro, Enhance Freeway Service Patrol (FSP) o operation/deployment. Work with CHP to improve enforcement and incident management o Improve HOV vehicle detection infrastructure o Long Term HOV Direct Connectors o Increase occupancy in conjunction with HOT conversion in HOV o facility where adding an additional lane is feasible (I-105) 19
Conclusion In 2011, California HOV lanes carried about 13% of the traffic on the freeway during the morning peak hour and 15% during the evening peak hour Overall increase in congestion in the latter half of the year, particularly after school begins in the late summer Recurrent congestion or other factors could be causing degradation The 2011 HOV Degradation Report and Action Plan were developed in compliance with federal laws The 180-day timeframe to remediate degradation begins when the report was submitted to the FHWA, on August 1 st , 2013 Our long record of working closely with FHWA will help us to continue to find efficient and effective solutions to HOV degradation challenges. 21
What’s Next? Awaiting for official response from FHWA. Anticipated to be received in September 2013 2012 Degradation Report is currently in progress Additional studies may be needed . 22
THANK YOU QUESTIONS OR COMMENTS? Ali Zaghari Deputy District Director, Caltrans District 7 Division of Traffic Operations Email: Ali.Zaghari@dot.ca.gov 23
Recommend
More recommend