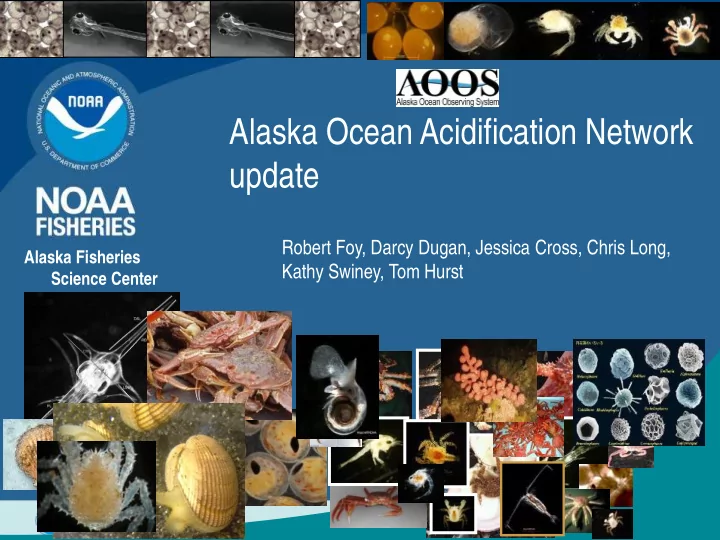

Alaska Ocean Acidification Network update Robert Foy, Darcy Dugan, Jessica Cross, Chris Long, Alaska Fisheries Kathy Swiney, Tom Hurst Science Center
Connecting Scientists and Stakeholders
Global CO 2 Levels Continue to Rise 22 tons CO 2 every day 1/3 absorbed by ocean Alaskan waters naturally high in CO 2
Global CO 2 Levels Continue to Rise 22 tons CO 2 every day 1/3 absorbed by ocean Alaskan waters naturally high in CO 2
Global CO 2 Levels Continue to Rise 22 tons CO 2 every day 1/3 absorbed by ocean Alaskan waters naturally high in CO 2
Global CO 2 Levels Continue to Rise Monitoring sounded the alarm! 408 ppm • 25-30% of carbon source increases end up in the ocean sink. • Average pH of ocean surface waters decreased by about 0.1 units (~8.2 to 8.1 [total scale] since 1765) 22 tons CO 2 • ~30% increase in acidity every day 1/3 absorbed by ocean Alaskan waters naturally high in CO 2
Global CO 2 Levels Continue to Rise 22 tons CO 2 every day 1/3 absorbed by ocean Alaskan waters naturally high in CO 2
Foodweb effects Direct effects (“indirect”) OA may reduce growth rates of juvenile fish, decreasing OA may reduce abundance of prey survival. for fishes. In particular pteropods have been shown to be sensitive to OA. X X Cumulative effects X Over time OA my reduce the overall productivity of fish stocks resulting in reduced commercial and subsistence harvest levels. Sensory effects OA can interfere with sensory signals in the brain causing the fish to not recognize predators or prey. Ultimately reducing Infographic: Tom Hurst growth and survival.
+ H + Shellfish and corals need carbonate (inorganic carbonate) Calcium + Carbonate = Calcium Carbonate shell Changes found in many calcifying organisms • Changes in respiration rate • Changes in aerobic metabolism • Greater energy in shell maintenance • Less energy in reproduction and growth • Changes in stress tolerance https://www.pmel.noaa.gov
Kodiak Ocean Acidification research laboratory CO 2 Delivery System Experimental Tanks Treatment system: Holding Tanks • Flow through CO 2 delivery system • pH control • Daily pH, temperature, and salinity measurement • Weekly water samples taken for DIC and Alkalinity
Multi-year lab experiment YEAR 1 YEAR 3 YEAR 2 Long et al. 2016 Swiney et al. 2016
Multi-year lab experiment YEAR 3 YEAR 2 YEAR 1 Long et al. 2016 Swiney et al. 2016
Evidence for crab to acclimate or adapt? Effects at oocyte and embryo stage significant Effects at larval stage minimal (no effect on mortality) • Decreased metabolism? Larvae that survived may be acclimating? • Adaptation due to variable environmental conditions? • Effects at juvenile stage significant Calcification vs condition tradeoff? • Adult crab maintain hemolymph pH Energy spent maintaining cell pH and immunological • function…effects development during oogenesis
Pollock eggs & larvae robust 11.0 Northern rock sole sensitive Time to hatch (days) 10.5 10.0 9.5 9.0 12 8.5 8.0 Ranked mortality rate 10 200 600 1000 1400 1800 2200 4.7 8 Length at hatch (mm) 4.6 4.5 6 4.4 4.3 4 4.2 High CO 2 r = 0.32 4.1 Medium CO 2 p = 0.054 2 4.0 Low CO 2 3.9 Ambient CO 2 0 250 500 750 1000 1250 1500 1750 200 600 1000 1400 1800 2200 CO 2 µATM 0.14 0.15 -1 ) 0.12 Growth rate (mm·d 0.10 0.10 0.05 0.00 0.08 -0.05 0.06 -0.10 0.04 -0.15 0.02 0 10 20 30 40 50 60 250 500 750 1000 1250 1500 1750 2000 Days post hatch CO 2 (µatm) Hurst et al (2013)
OA effects on Pacific cod larvae - growth & behavior High CO 2 also changed fish behavior by increasing their activity in a light gradient. OA reduced growth rates This may have implications during the first 2 weeks of for feeding in the wild. life, but fish compensated by 5 weeks. Hurst et al. 2019
Forecasting fisheries population effects Experimental results were used to inform population and economics models Laboratory data Population dynamics model Regional Economic Model (welfare analysis of OA) Bioeconomic model ( yield projections ) Seung et al. (2015); Punt et al. 2014 & 2016
Forecasting fisheries population effects Experimental Tanner crab results were used to inform population and economics models Proportion larvae hatching that survive to juvenile stage C8 could decline by 25% over 100 y. • >50% decrease in catch and profits within 20 years of EBS acidifying to 7.8 • • Only significant when oocyte development is included in survival estimates • $500 million - $1 billion welfare loss to Alaska households Snow Crab Story Better! Regional Economic Model (welfare analysis of OA) Bioeconomic model ( yield projections ) Seung et al. (2015); Punt et al. 2014 & 2016
• NOAA Ocean Acidification Program • AOOS Ocean Acidification Network • UAF Ocean Acidification Research Center • Pacific Marine Environmental Lab • Alaska Fisheries Science Center Kodiak Laboratory Research Staff Thank you! http://www.afsc.noaa.gov/RACE/shellfish/oceanAcid/oceanAcidCurrent_HOME.php
Recommend
More recommend