
Acidification indicators for the Baltic Sea Jacob Carstensen, Bo Gustafsson, Gregor Rehder
Ocean versus coastal acidification Doney et al. (2010) Science Duarte et al. (2013) ESCO
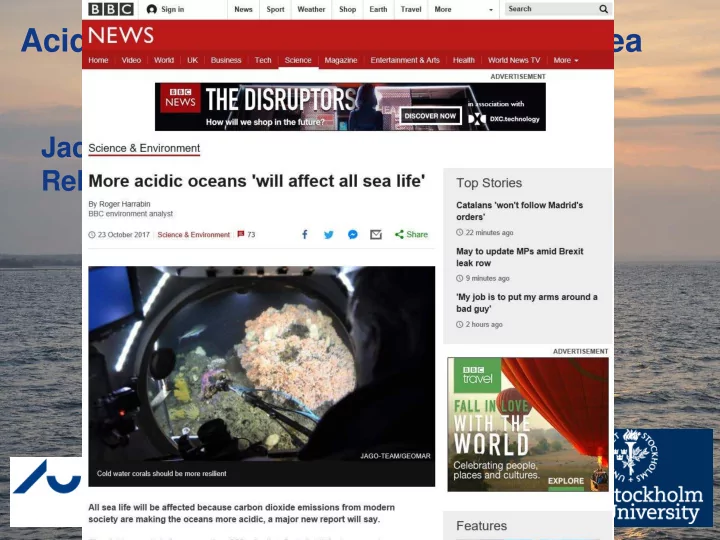
The simple concept of ocean acidification does not apply to coastal ecosystems Many different processes affect pH in the coastal zone • Catchment characters affecting inputs from land (weathering, mining, liming, etc.) • Atmospheric deposition • Eutrophication • Metabolism • CO 2 exchange with the atmosphere • Warming
Baltic Sea trends in pH Laajalahti, 8.8 Baltic Sea 8.4 pH 8.0 7.6 7.2 1950 1960 1970 1980 8.4 1990 2000 2010 2020 Gotland Basin, Baltic Sea 8.2 pH 8.0 7.8 7.6 8.4 Bornholm Basin, 1950 1960 1970 1980 1990 2000 2010 2020 Baltic Sea 8.2 pH 8.0 7.8 1950 1960 1970 1980 1990 2000 2010 2020
Baltic Sea trends in pH 7.6 Kemi, Baltic Sea 7.4 pH 7.2 7.0 8.4 1950 1960 1970 1980 1990 2000 2010 2020 Bothnian Bay, 8.2 Baltic Sea 8.0 pH 7.8 7.6 7.4 8.4 Bothnian Sea, 1950 1960 1970 1980 1990 2000 2010 2020 Baltic Sea 8.2 pH 8.0 7.8 7.6 1950 1960 1970 1980 1990 2000 2010 2020
Baltic Sea trends in pH 8.4 Mariager Fjord, Danish Straits 8.2 pH 8.0 7.8 7.6 1950 1960 1970 1980 1990 2000 2010 2020 8.6 The Sound, Danish Straits 8.4 8.2 pH 8.0 7.8 7.6 7.4 8.6 Kattegat, Danish Straits 1950 1960 1970 1980 1990 2000 2010 2020 8.4 8.2 pH 8.0 7.8 7.6 1950 1960 1970 1980 1990 2000 2010 2020
Increasing alkalinity might buffer against acidification Mississippi River Ohio River Raymond & Cole (2003) Science Duarte et al. (2013) ESCO
Spatial and temporal trends in total alkalinity Müller et al (2016) Limnol Oceanogr Central Baltic Sea
Alkalinity trends – adjusted for salinity Müller et al (2016) Limnol Oceanogr
A look at three different estuaries with long-term data on pH and alkalinity • Shallow • pH from 6.1 to 10 • A T from 0.6 to 3.4 mmol kg -1 • Different end- members Carstensen et al (Subm.) GBC
Roskilde Fjord receives freshwater with high pH and alkalinity 10 Boundary Roskilde Fjord C) Inside 9 pH TOT 8 7 6 0 5 10 15 20 25 30 35 Salinity 4.0 Roskilde Fjord D) Boundary Inside 3.5 Alkalinity (mmol kg -1 ) 3.0 2.5 2.0 1.5 Carstensen et al (Subm.) 0 5 10 15 20 25 30 35 GBC Salinity
Skive Fjord end-members are similar 10 Boundary E) Inside 9 pH TOT 8 7 Skive Fjord 6 0 5 10 15 20 25 30 35 Salinity 3.0 Skive Fjord F) 2.5 Alkalinity (mmol kg -1 ) 2.0 1.5 1.0 Boundary Inside 0.5 Carstensen et al (Subm.) 0 5 10 15 20 25 30 35 Salinity GBC
Changes in pH (observed and adjusted for sali/temp effects on carbonate speciation) 8.6 8.6 A) B) 8.4 8.4 P=0.0011 8.2 8.2 P=0.0080 8.0 8.0 pH TOT pH TOT 7.8 7.8 7.6 7.6 Ringkøbing Fjord (1980-1995) Ringkøbing Fjord (1980-1995) P<0.0001 P<0.0001 Ringkøbing Fjord (1996-2016) Ringkøbing Fjord (1996-2016) 7.4 7.4 Roskilde Fjord Roskilde Fjord Skive Fjord Skive Fjord 7.2 7.2 J F M A M J J A S O N D 1970 1980 1990 2000 2010 2020 8.6 Ringkøbing Fjord (1980-1995) 8.6 Ringkøbing Fjord (1996-2016) 8.4 8.4 Roskilde Fjord P=0.0317 Skive Fjord 8.2 8.2 P=0.0034 8.0 pH adjusted pH adjusted 8.0 7.8 7.8 7.6 P<0.0001 7.6 Ringkøbing Fjord (1980-1995) 7.4 Ringkøbing Fjord (1996-2016) 7.4 P<0.0001 7.2 Roskilde Fjord Skive Fjord 7.0 7.2 J F M A M J J A S O N D 1970 1980 1990 2000 2010 2020
Alkalinity is not behaving conservatively 0.8 Alkalinity source Alkalinity residual (mmol kg -1 ) B) 0.6 P=0.5268 • Decalcification 0.4 P=0.0070 0.2 • Denitrification and 0.0 -0.2 sulfate reduction P=0.8197 P=0.0013 -0.4 -0.6 • Nitrate uptake 1970 1980 1990 2000 2010 2020 • Atmospheric deposition 0.8 Alkalinity residual (mmol kg -1 ) A) 0.6 Alkalinity sink 0.4 0.2 • Calcification 0.0 -0.2 Ringkøbing Fjord (1980-1995) Dilution/concentration by Ringkøbing Fjord (1996-2016) -0.4 Roskilde Fjord Skive Fjord rain -0.6 J F M A M J J A S O N D
Other components of the carbonate system 3.0 3.0 C) D) 2.5 2.5 P=0.0292 DIC (mmol kg -1 ) DIC (mmol kg -1 ) 2.0 2.0 P<0.0001 1.5 1.5 1.0 1.0 Ringkøbing Fjord (1980-1995) P=0.0040 P=0.0607 Ringkøbing Fjord (1996-2016) 0.5 0.5 Roskilde Fjord Skive Fjord 0.0 0.0 1970 1980 1990 2000 2010 2020 J F M A M J J A S O N D 2000 4000 E) F) Ringkøbing Fjord (1980-1995) Ringkøbing Fjord (1996-2016) 1500 3000 Roskilde Fjord pCO 2 (µatm) pCO 2 (µatm) Skive Fjord P=0.0014 P<0.0001 1000 2000 500 1000 P=0.0009 P<0.0001 0 0 1970 1980 1990 2000 2010 2020 J F M A M J J A S O N D
Estuarine effects on biology and climate 4000 5 Ringkøbing Fjord (1980-1995) E) Possible physiological G) Ringkøbing Fjord (1980-1995) Ringkøbing Fjord (1996-2016) Ringkøbing Fjord (1996-2016) 4 Roskilde Fjord 3000 effects from high Roskilde Fjord Skive Fjord pCO 2 (µatm) Ω Aragonite 3 extracellular pCO 2 2000 2 1000 1 0 0 8 J F M A M J J A S O N D J F M A M J J A S O N D I) 6 Net sources of CO 2 to the Ω Calcite atmosphere 4 2 Massive colonisation by 0 Mya arenaria occurred J F M A M J J A S O N D despite low Ω -values
Summary and discussion points • The Baltic Sea exhibits quite variable pH trends – different from ocean acidification • Enhanced alkalinity input may buffer acidification • Changes in pH is mainly an indicator of the balance between production and respiration • Monitoring pH and alkalinity is relatively inexpensive and provides important insight into carbon cycling
Recommend
More recommend