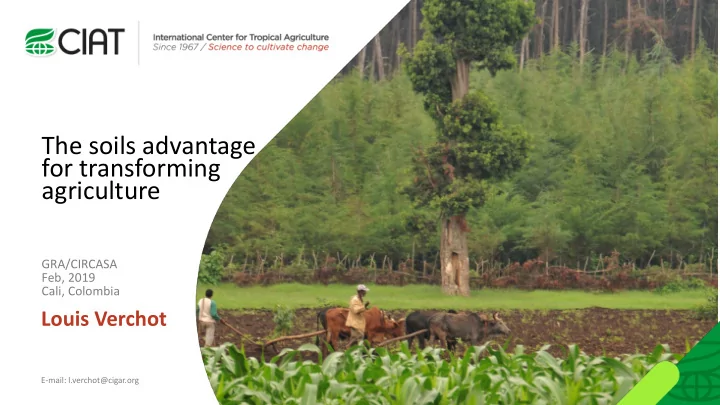

The soils advantage for transforming agriculture GRA/CIRCASA Feb, 2019 Cali, Colombia Louis Verchot E-mail: l.verchot@cigar.org
Anthropogenic perturbation of the global carbon cycle Perturbation of the global carbon cycle caused by anthropogenic activities, averaged globally for the decade 2008 – 2017 (GtCO 2 /yr) Agricultural Non-CO 2 : The budget imbalance is the difference between the estimated emissions and sinks. Source: CDIAC; NOAA-ESRL; Le Quéré et al 2018; Ciais et al. 2013; Global Carbon Budget 2018 6 Gt CO 2 e (CH 4 & N 2 O)
20 conservation, restoration, and improved land management actions to increase C storage/avoid GHG emissions across forests, wetlands, grasslands, and agricultural lands • 23.8 Gt of CO 2 equivalent per year • About half of this is cost-effective • Natural climate solutions: • 37% mitigation needed through 2030 • >66% chance of warming to below 2°C if combined with aggressive fossil fuel emissions limits • Co benefits • water filtration • flood buffering • soil health • biodiversity habitat • enhanced climate resilience Source: Griscom et al. PNAS 2018
The contribution of natural climate solutions decreases over time and the proportion depends on the baseline • RCP 8.5 trajectory (black line) • The green area:cost effective NCS (aggregate of 20 pathways) • % of needed mitigation • 37% through 2030, • 29% at year 2030, • 20% through 2050, • 9%through 2100 Source: Griscom et al. PNAS 2018
Soil solutions Biochar • 0.6 to 6 Gt CO 2 y -1 • Requires available biomass • 3 Gt if all forest slash and 50% crop residue used • 6 Gt if 80 % of all harvested biomass is used. • US$30 and 50/tCO 2 • Meta analysis: Crop productivity increases by 10% (high variability) • Lower N 2 O and CH 4 emissions • Albedo • Changes in soil microbial community? Sources: data Fuss et al. 2018; Image ETH Zurich
Soil solutions • Review of 22 articles • Shading shows the percentage of studies with max potential ≥ each value • Technical potentials Gt CO 2 yr − 1 • 1.3 – 2.9 for croplands, • 0.7 – 1.7 desertification control • 3.6 dryland ecosystems • 1. 5 – 3.7 reclamation of agricultural soils • 0.4 – 0.6 for no tillage in croplands • 0.5 – 1.3 for degraded land restoration • 4 – 8 for agro-forestry • 1.1 – 2.5 through forestry and agriculture • 3.3 – 6.7 in croplands • 1.4 – 2.7 for croplands and pastures • 0.15 and 0.20G for grazing optimization and planting of legumes in grazing land Sources: data Fuss et al. 2018
Where in the world is soil carbon? Source: Zomer et al 2017, SoilGrids database
Where in the world’s croplands can you sequester soil C?
Tropical peatlands: some new understandings • 3% of the global land area, 30% of the global soil carbon, 6% in the tropics Global drained and burned peatlands: 1GtCO 2 e.yr -1 (10% of global GHG • emissions in 2000-2009) (IPCC AR5) • Transboundary haze effects • Mitigation and adaptation synergies, and co-benefits (water, biodiversity, livelihoods, etc.) • Transparency initiatives: TRASE. Connecting commodity producers, distributors and consumers. • New data on histosols and peatlands.
Under-reported peatland hotspots South America : Amazon Basin, Rio La Plata, Ibera Wetlands Asia : Bangladesh,all river deltas, Indonesian Papua Africa : Niger river delta, Angola, Zambia, South Sudan. Gumbricht et al. (2017) Global Change Biology
Mitigation potential of tropical peatlands Volume km 3 Total area Mkm 2 Depth (m) Stocks GtC Estimates in Page et al., 0.44 1,758 2.3 89 (2011) (0.39-0.66) (1,585-1,822) Gumbricht et al. (study 6,991 area of Page et al., 1.5 2.5 352 (5,765-7,079) (2011) • Tropical peat stocks: Four-fold increase (89 to 352 GtC) Mitigation potential using conservative annual emissions : 0.3 GtC.yr -1 (IPCC AR5) Source: Gumbricht et al. 2017 Global Change Biology.
Thank you
Recommend
More recommend