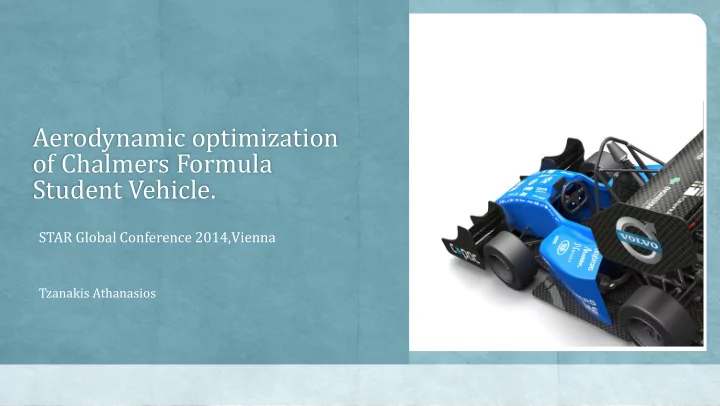

Aerodynamic optimization of Chalmers Formula Student Vehicle. STAR Global Conference 2014,Vienna Tzanakis Athanasios
Presentation Layout • Problem description. • Approaching the optimum solution. • Goals definition. • Simulations methodology. • Areas of interest. • Results.
The problem The average speed of a Formula Student vehicle is approximately 56kph. What is the contribution of aerodynamics in vehicles performance in such a low speed?
Approaching the optimum solution Ideas 3D Mathematical Simulations calculations 2D Design Simulations
Aerodynamics necessity 76 74 72 Lap’s Time (s) 160 kg 70 180 kg 200 kg 68 220 kg 66 64 62 NO AERO AERO
Goals Design Targets Downforce 500-550 N at 56 km/h Drag 200-250 N Down force/Drag ratio 2.75 Mass flow over radiator 0.42 kg/s Weight 16 kg
Ideas Rear wing Sidepods Diffuser Front wing
Simulations on STAR-CCM + 2D 3D
2D Simulations Physics : • Steady state • Segregated flow • Realizable 𝑙 − 𝜁 • two-layer treatment Observables: • Airfoil profile • Angle of attack
3D Simulations • Ansa • Star-CCM+ Surface wrapper Surface mesh • Star-CCM+ Volume mesh • Star-CCM+ Solver • Star-CCM+ Post Processing
Mesh and refinement boxes • Wind tunnel (4Lx4Lx20L) • 6 refinement boxes • Polyhedral mesh mainly • Aligned mesh for radiator • 3 prism layers
Mesh and refinement boxes
Defining the physics Models Realizable k- ε , Standard wall function Steady State Segregated Free flow velocity 15.6m/s Floor boundary condition 15.6 m/s Wheels MRF zone Coefficient of inertial resistance in radiator (184.3 kg/m 3 , 184.3 ×10 2 kg/m 3 , 184.3 ×10 2 kg/m 3 ) Coefficient of porous resistance in radiator (222.6 kg/m 3 s, 222.6 ×10 2 kg/m 3 s, 222.6 ×10 2 kg/m 3 s) Iterations 1000
Areas of interest Diffuser Wings set up optimization Mass Flow Brake over cooling radiator
Front Wing Development Not well balanced vehicle.
Front Wing Evaluation 225 220 215 210 205 200 195 Local Downforce (N) 190 Total Drag (N) 185 180 175 170 Two-element wing Three element Three element wing wing 2nd conf.
Rear wing development and evaluation 250 200 150 Local Downforce (N) 100 Total Drag (N) 50 0 Three element wing Three element wing 2nd conf.
Endplates shape evaluation Rear Endplates 250 200 Newtons 150 Local Downforce (N) 100 Total Drag (N) 50 0 Endplate Endplate Endplate concept 1 concept 2 concept 3
FEM on rear wing Case Carbon H35 Total Weight Deflection 0.3mm - 3 Ribs(13x15mm) 0.863 0.26411 1.12711 7.6985 0,3mm - No Rib(12x15mm) 0.863 0.276 1.139 9.0616 0.3mm - 3 Ribs(13x17,5mm) 0.863 0.284 1.147 7.1847 0.3mm - 3 Ribs(16x15mm) 0.863 0.2947 1.1577 7.45 0.3mm - 3 Ribs(13x20mm) 0.863 0.3083 1.1713 6.8529 0.3mm - 3 Ribs Bigger Rear 0.863 0.322 1.185 6.9075 0.3mm - 3 Ribs(20x15mm) 0.863 0.334 1.197 7.334 0,33mm - 1 Rib(12x15mm) 0.863 0.371 1.234 9.0215 0.3mm - 3 Ribs+Nomex 0.94 0.3083 1.2483 6.83 FEM by Elanghovan Natesen natesan@student.chalmers.se
Diffuser Development
Diffuser Evaluation Efficiency increased by 26%
Diffuser Evaluation Not interaction between flap and diffuser.
FEM on diffuser FEM by Elanghovan Natesen natesan@student.chalmers.se
Sidepod development Gap for radiator cooling.
Sidepod evaluation Massflow: 0.3 kg/s Massflow: 0.46 kg/s
Brake cooling The problem: Overheated disk brakes effected vehicle stability and braking distance.
Brake cooling Many different geometries in limited area so Star-CCM+ surface wrapper was directly applied.
Brake evaluation Initial Heat transfer coef. Final 155 150 W/m2-K 145 Local heat 140 transfer coefficient 135 Neutral Short Long duct duct
Full vehicle simulations Test Angle(deg) Velocity(m/s) Mx(Nm) My(Nm) Mz(Nm) Fx(N) Fy(N) Fz(N) Yaw 0 15.6 5.73 -194.4 2.57 222 2.47 -410 Yaw 5 15.6 -4.1 -184.5 -29.4 227.7 45.6 -409 Roll 1.2 15.6 -1.55 -199 7.75 220 -9.57 -392
Results Design Targets Goals Final objectives Downforce 500-550 N at 56 km/h 462 N at 56 km/h Drag 200-250 N 234 Down force/Drag ratio 2.75 1.97 Mass flow for radiator 0.42 kg/s 0.46 Weight 16 kg 10kg
Thank you! Rendering by Bjorn Schlingmann Bjoern.schlingmann@gmail.com
Thank you! Rendering by Bjorn Schlingmann Bjoern.schlingmann@gmail.com
Questions ? Rendering by Bjorn Schlingmann Bjoern.schlingmann@gmail.com
Recommend
More recommend