Actual Average Daily Population of Adult Inmates 4000 3500 3000 - PowerPoint PPT Presentation
Actual Average Daily Population of Adult Inmates 4000 3500 3000 2500 2000 1500 1000 500 0 FY FY FY FY FY FY FY FY FY FY FY FY FY FY FY 05 06 07 08 09 10 11 12 13 14 15 16 17 18 19 ADP 3144 3428 3378 3344 3387
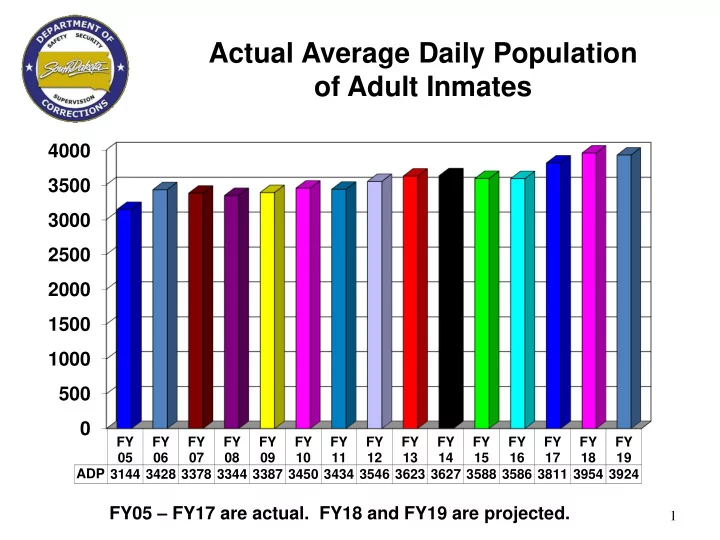
Actual Average Daily Population of Adult Inmates 4000 3500 3000 2500 2000 1500 1000 500 0 FY FY FY FY FY FY FY FY FY FY FY FY FY FY FY 05 06 07 08 09 10 11 12 13 14 15 16 17 18 19 ADP 3144 3428 3378 3344 3387 3450 3434 3546 3623 3627 3588 3586 3811 3954 3924 FY05 – FY17 are actual. FY18 and FY19 are projected. 1
Facility Count Fiscal Year 2019 Projected Male Female Total Durfee State Prison 1,266 1,266 State Penitentiary 755 755 Jameson Secure 506 506 SF Com work center 223 223 YK Com work center 315 315 RC Com work center 315 315 Women’s Prison 231 231 Pierre Com work center 166 166 Unit E – Pierre 103 103 Community 44 Total 3,380 544 3,924 2
Breakdown of Crimes of SD Inmates Male Female Dec-17 15% Violent 27% Violent - 80 Violent - 1,589 Drug 22% 47% Non-violent Non-violent - 117 Non-violent - 905 Violent 64% Drug - 344 Drug - 919 27% Drug Non-violent Total Female Inmates - 541 Total Male Inmates - 3,413 Breakdown of Drug Crimes of SD Inmates Dec-17 Female Male Dist. of CS Dist. of CS 1% Dist./Poss of MJ 11% Dist. of MJ 16% Dist. of CS - 143 26% Dist. of CS - 38 35% 5% Dist. of MJ - 43 Dist./Poss. of MJ - 2 Ingest. of CS Ingest. of CS Poss. of CS - 483 Poss. of CS - 183 1% 53% 53% Poss. of MJ - 13 Ingest. of CS - 121 Poss. of CS Ingest. of CS - 237 Poss. of CS Poss. of MJ 3 Total Drug Crimes - 344 Total Drug Crimes - 919
Racial Breakdown of Adult Inmates Prison Population 11/30/17 Male Female Total White # 1938 237 2175 White % 57.0% 45.1% 55.4% Native American # 1011 263 1274 Native American % 29.7% 50.1% 32.5% Black # 297 8 305 Black % 8.7% 1.5% 7.8% Hispanic # 127 16 143 Hispanic % 3.7% 3.0% 3.6% Asian/Pacific Islander # 21 1 22 Asian/Pacific Islander % 0.6% 0.2% 0.6% Other # 5 0 5 Other % 0.1% 0.0% 0.1% Total 3399 525 3924 4
Male Population Projections by Custody Classification – End of Year Capacity FY 18 FY 19 FY 20 FY 21 FY 22 12/30 MN/CTP/EC 999 929 936 942 949 956 919 LM 1275 1307 1317 1326 1336 1345 1309 HM/DET 837 688 693 698 703 708 697 MX 256 138 139 140 141 142 144 SPEC 538 275 277 279 281 283 248 TMPA 34 35 35 35 35 38 UNCLASS 69 69 70 70 71 60 TOTAL 3905 3440 3465 3490 3515 3540 3415 5
Female Population Projections by Custody Classification End of Year Capacity FY 18 FY 19 FY 20 FY 21 FY 22 12/31 MN/CTP/EC 255 286 295 297 301 304 283 LM 132 132 136 137 139 140 137 HM/DET 44 45 46 46 47 47 MX 42 11 11 11 12 12 14 SPEC 94 66 68 69 69 70 52 Secure Total 268 253 261 263 266 269 250 TMPA 6 6 6 6 6 5 UNCLASS 6 6 6 6 6 3 TOTAL 523 550 567 572 578 584 541 6
Adult Recidivism Historical Summary Total Recidivists from 2004-2015 50% 45.4% 46.0% 44.9% 44.8% 44.1% 43.8% 43.7% 43.1% 45% 42.5% 40.6% 41.0% 40.3% 40.7% 40.6% 39.3% 38.8% 38.5% 38.0% 40% 36.4% 33.9% 35% 32.6% 31.2% 29.9% 29.5% 29.3% 28.7% 28.2% 30% 25.9% 26.1% 26.4% 23.0% 25% 21.3% 20.4% 20% 15% 10% 5% 12 months 24 months 36 months 0% 2004 2005 2006 2007 2008 2009 2010 2011 2012 2013 2014 2015 12 months 633/216 620/207 628/201 590/205 501/193 365/171 599/2033 546/1933 473/1815 505/1912 369/1812 408/1775 # of Recidivists/ # 4 2 2 8 4 5 Released 24 months 850/216 850/207 811/201 788/205 745/193 581/171 827/2033 785/1933 661/1815 727/1912 590/1812 # of Recidivists/ # 4 2 2 8 4 5 Released 36 months 954/216 954/207 904/201 887/205 848/193 697/171 924/2033 867/1933 771/1815 835/1912 # of Recidivists/ # 4 2 2 8 4 5 Released 7
Parole Services Average End of Month Count FY 04 - FY 17 are actual; FY 18 and FY 19 are projected. 8
Population Response – Expanded a limited number beds • Community based contracts for CTP offenders • Expansion at the PCWC and DSP and reconfiguring at WP • Use of SHU beds for detainees – Maximizing State Reforms Grant (US Dept. of Justice) • 3 year; residential and community based program targeting Native American female probation violators – Policy revisions to best align practices with bed space (timelines/sanctioning) • Some low level major rule infraction responses adjusted to provide sanction without increase in custody status • Shortened the period of time classification level was impacted by certain institutional misconduct – Incentives for programs and work • PSIA data shows significant difference in recidivism for offenders completing substance abuse and MRT programming. • Pilot reentry program (PREP – Rapid City) provides incentives for participation • Work and program commutations • Effort to extend earned discharge credits to inmates for work and upon program completion (HB 1053) – Possible options to house parolees on CTP or on detainee status locally vs. in prison • SD has more than 300 parolees housed in prison units in the CTP program or as detainees. • Piloted community based programming for CTP as part of the PSIA • Developing expanded community capacity to provide services for CTP offenders locally vs in state prison • $1,144,640 in FY 19 recommended budget for 71 CTP community based beds. – Extended Confinement Program • Low risk inmates , close to release placed at home under parole supervision on GPS • Also, placement for services (medical or mental health) as a form of “medical clemency” 9
Recommend


More recommend
Explore More Topics
Stay informed with curated content and fresh updates.