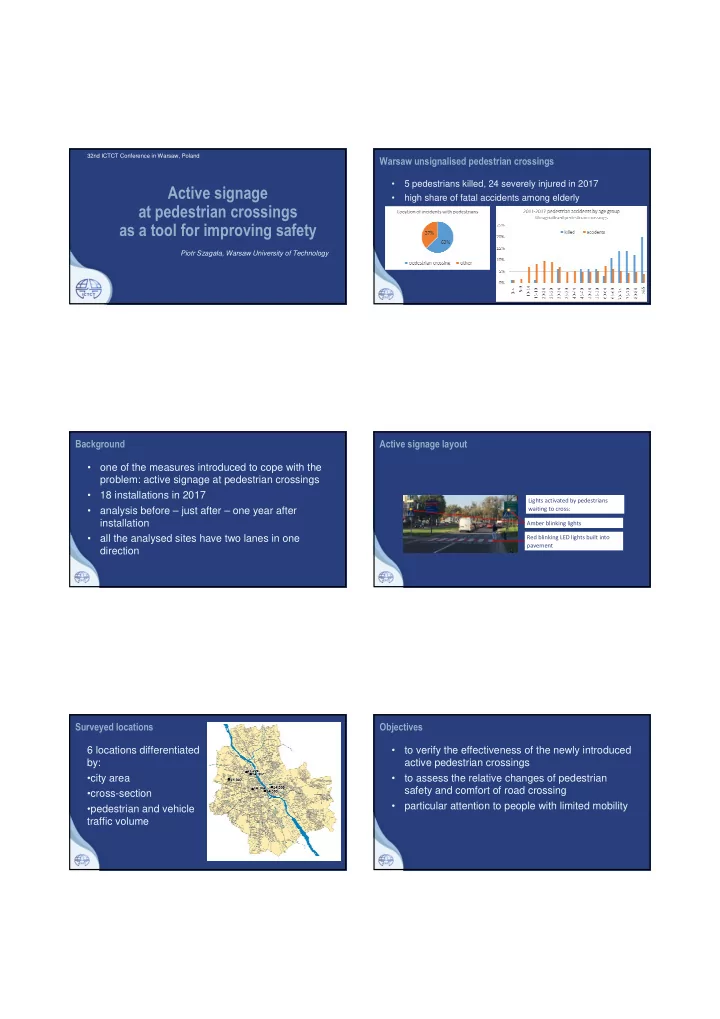

32nd ICTCT Conference in Warsaw, Poland Warsaw unsignalised pedestrian crossings • 5 pedestrians killed, 24 severely injured in 2017 Active signage • high share of fatal accidents among elderly at pedestrian crossings as a tool for improving safety Piotr Szagała, Warsaw University of Technology Background Active signage layout • one of the measures introduced to cope with the problem: active signage at pedestrian crossings • 18 installations in 2017 Lights activated by pedestrians • analysis before – just after – one year after waiting to cross: installation Amber blinking lights • all the analysed sites have two lanes in one Red blinking LED lights built into pavement direction Surveyed locations Objectives 6 locations differentiated • to verify the effectiveness of the newly introduced by: active pedestrian crossings •city area • to assess the relative changes of pedestrian safety and comfort of road crossing •cross-section • particular attention to people with limited mobility •pedestrian and vehicle traffic volume
Method Method • video recording for 48 hours: before, just • pedestrian-vehicle conflicts after and one year after installation • traffic conflict rate • pedestrian and vehicle traffic volume • percentage of drivers yielding to pedestrians • ANOVA test to check the statistical significance • time lost by pedestrians waiting to cross of changes of the indicators • average speeds of vehicles approaching the crossings % drivers yielding Average waiting time Conflict rates Vehicle speeds 10 m upstream V = a+b 1 Q + b 2 δ 1 + b 3 δ 2 δ 1 = 1 just after δ 2 = 1 a year after
Drop in vehicle speeds 10 m upstream Analysis by user group • people without reduced mobility • people with reduced mobility speed standard speed difference error Significance difference • elderly R 2 site a year after - level just after - before before • with small children Popiełuszki 3,63 0,63 0 0,85 1,99 Ludna 0,6 0,61 0,324 0,68 0,89 Mickiewicza dir. 1 2,23 0,69 0,001 0,73 1,52 • disabled Mickiewicza dir. 2 2,94 0,87 0 0,63 5,52 Grzybowska 6,74 0,66 0 0,85 4,61 Powsta ń ców Ś l ą skich 2,18 0,47 0 0,82 4,6 • with baby stroller Waszyngtona dir. 1 1,4 0,5 0,005 0,60 2,61 Waszyngtona dir. 2 1,7 0,48 0 0,74 4,09 • pedestrians in groups Analysis done for 4 sites % drivers yielding to pedestrians Dangerous situations • The following situations were classified as dangerous: • potential conflict - pedestrians and drivers do not change behaviour, but are dangerously close to each other • serious conflict - users’ trajectories cross and they undertake rapid actions to avoid collision • a vehicle passes another vehicle that has stopped to yield to the pedestrians
Dangerous encounters by user group Conclusions • positive effect lasting a year, measured by "comfort" of crossing the road • conflict analysis may indicate an increase in risk, although it is difficult to make clear conclusions • results differ significantly among crossings – a need for individual approach • higher willingness to yield identified for people with reduced mobility and for groups • improper functioning of pedestrians’ detection
Conclusions Thank you for your attention • lasting effect of reducing the number of dangerous situations identified only for groups • other users: returning to the before situation or similar share of dangerous situations in all three periods of analysis • pedestrian crossings with two lanes in one direction should be narrowed to one lane or signalised p.szagala@il.pw.edu.pl • as a temporary solution speed cushions can be installed
Recommend
More recommend