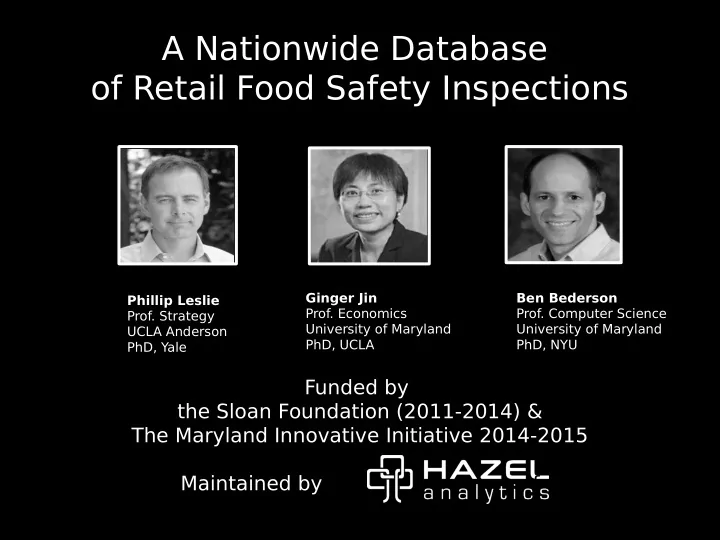

A Nationwide Database of Retail Food Safety Inspections Ginger Jin Ben Bederson Phillip Leslie Prof. Economics Prof. Computer Science Prof. Strategy University of Maryland University of Maryland UCLA Anderson PhD, UCLA PhD, NYU PhD, Yale Funded by the Sloan Foundation (2011-2014) & The Maryland Innovative Initiative 2014-2015 Maintained by f
Our Data Data posted online by Warehouse local jurisdictions Coverage (2015) (as of 2012) • 87 local health departments • 34 States • 895K unique establishments • 6.8M inspection records • 18.5M violations
Heterogeneity and Fragmentation • Out of 87 jurisdictions with online posting of data: • 12 provide no numerical count of violations (due to pdf publishing and other non-numerical formats) • 23 provide explicit grading in either letter grades or numerical points • Number of inspection records per establishment ranges from 1 to 38 • Number of violations per inspection ranges from 0.066 in San Diego County to 9.35 in Fort Worth City, TX
Example insights from our database • Of NYC inspections 41% report at least one violation whose description contains the words rodent, vermin, fmies, mice, pests, rats, or insects. • Compared to 11% in DC, 8% in LA (County), and 6% in Seattle (King County). • From lowest to highest violations (on average), restaurants with the following words in their establishment names: sandwich, salad, burger, pizza, pasta, japan/sushi, china/chinese. • Half of our covered jurisdictions indicate whether an inspection is a re-inspection. Among these jurisdictions, • on average 10.6% of routine inspections led to a re- inspection • 15.1% of the violations found in the routine inspection recurred in the re-inspection . • Both numbers range greatly across jurisdictions.
Consistency Number of violations per inspection 6.000 5.000 Chain 4.000 A 3.000 Chain B 2.000 Chain 1.000 C 0.000
Further evidence for consistency (11 jurisdictions in NY, WA, AK, AZ, OH and FL, 2010-2011) Dependent Variable = # of hospitalizations due to Poisson Model intestinal infection per zip code per year (1) (2) (3) # of violations per inspection 0.066*** 0.076*** 0.075*** (standardized) (0.022) (0.021) (0.022) ZIP pop x x x # of inpatients due to other digestive x x illnesses # of inpatients x due to all other illnesses Year FE x x x Jurisdiction FE x x x Standard error robust robust robust N 2678 2678 2678
T o summarize • Online posting of government-collected data is only the fjrst step – Signifjcant efgort is needed in centralization, cleaning, documentation, archive, and continuation • Large potential to utilize the “big data” – For research – For government policy evaluation – For enhanced compliance • We welcome data request!
Recommend
More recommend