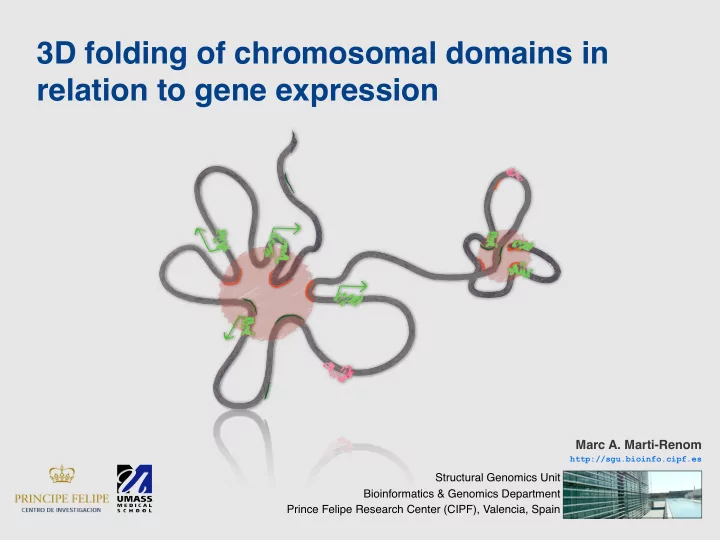

3D folding of chromosomal domains in relation to gene expression Marc A. Marti-Renom http://sgu.bioinfo.cipf.es Structural Genomics Unit Bioinformatics & Genomics Department Prince Felipe Research Center (CIPF), Valencia, Spain
Resolution Limited knowledge... Knowledge DNA length 100 103 106 109 nt Volume 10-9 10-6 10-3 100 103 μm3 Time 10-10 10-8 10-6 10-4 10-2 100 102 103 s Resolution 10-3 10-2 10-1 μ 2 Adapted from: Langowski and Heermann. Semin Cell Dev Biol (2007) vol. 18 (5) pp. 659-67
Structure determination Integrative Modeling Platform http://www.integrativemodeling.org NMR structure determination 2D-NOESY data Chromosome structure determination 5C data 3 Alber et al. Nature (2007) vol. 450 (7170) pp. 683-94
Integrative and iterative approach Experiments Computation 4
Human α -globin domain ENm008 genomic structure and environment chr16: p13.3 13.2 12.3 p12.1 16p11.2 11.1 q11.2 q12.1 13 16q21 22.1 q23.1 0| 50000| 100000| 150000| 200000| 250000| 300000| 350000| 400000| 450000| 500000| LOC1001134368 RAB11FIP3 C16ORF35 SNRNP25 ARHGDIG RHBDF1 MRPL28 POLR3K LUC7L ITFG3 RGS11 PDIA2 AXIN1 TMEM8 DECR2 HB � 2 HB � 1 MPG HB � HB � HB � CTCF CTCF CTCF CTCF CTCF HS48 HS46 HS40 CTCF HS33 HS10 HS8 CTCF CTCF CTCF GM12878 diff RNA K562 GM12878 CTCF K562 GM12878 H3K4me3 K562 GM06990 DNaseI K562 • RNA expression data from the transcriptome group at Affymetrix and Cold Spring Harbor Laboratories. • CTCF and h istone modifications (H3K4me3) from the Broad Institute and the Bradley E. Bernstein Lab at the Massachusetts General Hospital/Harvard Medical School. • DNaseI data from the Crawford Lab at Duke University and at the Collins Lab at NHGRI. ENCODE Consortium. Nature (2007) vol. 447 (7146) pp. 799-816 5
5C experiments http://my5c.umassmed.edu Formaldehyde Cross-linking Primer ligation Grow GM12878 and K562 cells PCR amplification Digestion Perform 3C analysis Microarray Perform 5C analysis with 30+25 primers Ligation DNA sequencing Analyze 5C products by paired-end Solexa sequencing Reversal of Cross-links PCR Amplification (131,947 paired end reads per library) GM12878 K562 6 B. R. Lajoie, N. L. van Berkum, A. Sanyal et al., Nat Methods 6 (10), 690 (2009).
Integrative Modeling http://www.integrativemodeling.org P1 P2 7
Consistency GM12878 K562 Cluster #1 Cluster #2 2780 model 314 model 910,280 IMP OF 232,673 IMP OF 150 nm 100 125 nm 80 100 nm 75 nm 60 50 nm 40 Consistency (%) 20 GM15787 0 100 150 nm 125 nm 80 100 nm 75 nm 60 50 nm 40 20 K562 0 Fragment 8
Compactness GM12878 K562 Cluster #1 Cluster #2 2780 model 314 model 910,280 IMP OF 232,673 IMP OF GM06990 DNaseI K562 110 Density (nt/1nm) 100 K562 GM12878 90 80 70 60 50 40 Fragment 8
Regulatory elements GM12878 K562 Cluster #1 Cluster #2 2780 model 314 model 910,280 IMP OF 232,673 IMP OF 400 300 Distance (nm) 200 1,000 �������� 100 �������� CTCFs CTCFs HSs HSs 0 Non regulatory Non regulatory 800 K562 Distance (nm) 600 400 20 GM12878 ���������������� 10 200 % 0 0 * * ** ** * * * * * 10 α-globin K562 20 100 150 200 250 Distance (nm) 8
Multi-loops GM12878 K562 Cluster #1 Cluster #2 2780 model 314 model 910,280 IMP OF 232,673 IMP OF 68Kb 64Kb 700 >=250 GM12878 44Kb 65Kb 50Kb 600 45Kb Distance between anchoring points (nm) Path length (nm) 52Kb 500 205 35Kb 20Kb 400 300 161 300 400 500 117 55Kb 30Kb 600 63Kb 64Kb K562 700 55Kb 68Kb 73 69Kb 8
Expression GM12878 K562 Cluster #1 Cluster #2 2780 model 314 model 910,280 IMP OF 232,673 IMP OF GM12878 RNA diff K562 Increased in GM12878 = Increased in K562 8
Summary 5C data results in comprehensive interaction matrices to build a consistent 3D model 9
Summary Selected models reproduce known ( and new ) interactions chr16: p13.3 13.2 12.3 p12.1 16p11.2 11.1 q11.2 q12.1 13 16q21 22.1 q23.1 0| 50000| 100000| 150000| 200000| 250000| 300000| 350000| 400000| 450000| 500000| LOC1001134368 RAB11FIP3 C16ORF35 ARHGDIG SNRNP25 RHBDF1 MRPL28 POLR3K LUC7L ITFG3 RGS11 PDIA2 AXIN1 TMEM8 DECR2 HB � 2 HB � 1 MPG HB � HB � HB � CTCF CTCF CTCF CTCF CTCF HS48 HS46 HS40 CTCF HS33 HS10 HS8 CTCF CTCF CTCF 10
Summary Large-scale changes in conformation correlate with gene expression of resident genes LOC1001134368 RAB11FIP3 C16ORF35 ARHGDIG SNRNP25 RHBDF1 MRPL28 POLR3K LUC7L ITFG3 RGS11 PDIA2 AXIN1 TMEM8 DECR2 HBA2 HBA1 MPG HBZ HBM HBQ CTCF CTCF CTCF CTCF CTCF HS48 HS46 HS40 CTCF HS33 HS10 HS8 CTCF CTCF CTCF GM12878 diff RNA K562 11
Summary “ Chromatin Globule ” model � a b Factory Eraf � HBB PolII Münkel et al. JMB (1999) Osborne et al. Nat Genet (2004) Lieberman-Aiden et al. Science (2009) Phillips and Corces. Cell (2009) 12 � �
Acknowledgments Job Dekker Marc A. Marti-Renom Program in Gene Function and Expression Structural Genomics Unit Department of Biochemistry and Molecular Pharmacology Bioinformatics and Genomics Department University of Massachusetts Medical School Centro de Investigación Príncipe Felipe Worcester, MA, USA Valencia, Spain Amartya Sanyal Davide Baù Postdoctoral Fellow Postdoctoral fellow Dekker Lab Structural Genomics Unit Emidio Capriotti Bryan Lajoie Postdoctoral fellow Bioinformatician Structural Genomics Unit Dekker Lab
Recommend
More recommend