2013-2014 Budget Workshop Bambi J. Lockman, LL.D. 1 Index Section - PowerPoint PPT Presentation
2013-2014 Budget Workshop Bambi J. Lockman, LL.D. 1 Index Section 1: Department Responsibilities Section 2: Budget History-General Fund Section 3: Position History Section 4: K-12 Curriculum & School Improvement Section 5:
2013-2014 Budget Workshop Bambi J. Lockman, LL.D. 1
Index Section 1: Department Responsibilities Section 2: Budget History-General Fund Section 3: Position History Section 4: K-12 Curriculum & School Improvement Section 5: State Categorical Project Budgets Section 6: Professional Development Section 7: Career & Technical Education (CTE) Section 8: K-12 Program Accountability & Assessment Artifact 1 2
Index Con’t. Section 9: Federal Funding Section 10: Exceptional Student Education (ESE) & Student Services Section 11: Individuals with Disabilities Education Act (IDEA) Section 12: Student Services Section 13: Title I & Federal Grants & Projects Section 14: Summer Projects Section 15: Alternative Programs, Athletics & Security Section 16: Summation 3
Our Division K ‐ 12 Curriculum Administration Curriculum Development and School K ‐ 12 Program Improvement Accountability Services Federal Programs & ESE and Instructional Grants Student Services Development Services Alternative Programs, Professional Athletics and Development Security Health Services 4
Instructional Services Leadership Team Bambi Lockman Deputy Superintendent, Instructional Services Barbara Gary Leticia Vacant Bush Marks Roman Director, Alternative Director, Director, K-12 Director, ESE/ Student Education, Athletics & Curriculum & SIP Services Title I & Grants Security 5
Functions within Instructional Services Division What is a Function? A function is defined in the Redbook as a classification that indicates the overall purpose or objective of an expenditure. 5000 – Instruction 6100 – Pupil Personnel Services 6200 – Instructional Media Services 6300 – Instruction and Curriculum Development Services 6400 – Instructional Staff Training Services 7700 – Central Services 7900 – Operation of Plant Artifact 2 & 3 9100 – Community Services 6
7
Total General Fund Reduction 30,000,000 A Reduction of $8,940,107 25,000,000 $22,752,256 20,000,000 $13,812,149 15,000,000 10,000,000 5,000,000 0 2006-07 2012-13 Positions Department Non Salary Curriculum Projects 8
Volusia Enrollment 67000 70.00% 61.37% 66000 65867 60.00% 57.51% 56.42% 52.12% 65000 46.72% 50.00% FR/RD 64000 43.10% 63065 40.00% 63000 62329 ESE 62000 61559 30.00% 61524 61124 ELL 61000 20.00% 60000 Survey 2 16.21% 16.63% 16.42% 20.42% 20.08% 19.83% 10.00% 59000 4.25% 4.97% 4.78% 4.30% 4.59% 4.60% 58000 0.00% 9
10
Position History Instr uc tionalSe r vic e s Position and F unding Sour c e Histor y 100.0% 500 489.3 90.0% 484.2 444.4 432.8 427.0 80.0% 405.5 401.0 400 64.6% 70.0% 60.0% 55.0% 300 50.0% 40.0% 45.0% 200 30.0% 35.4% 20.0% 100 10.0% 0 0.0% 2007 2008 2009 2010 2011 2012 2013 11 Po sitio ns Ge ne ral F e de ral
Position History Instr uc tional Se r vic e s Position Histor y - Ge ne r al F und 400 Decrease of 95.6 FTE or 30.2% 350 316.3 301.0 300 256.3 242.6 250 220.7 217.1 200 187.3 150 100 50 0 12 2007 2008 2009 2010 2011 2012 2013
Position History Instructional Services by Category - General Fund Category 2007 2008 2009 2010 2011 2012 2013 Directors 5.6 4.6 3.9 3.9 2.9 2.4 2.2 Coordinators/Mgrs 7.6 7.6 5.9 4.6 8.0 8.2 7.9 Specialists/Facilitators 35.1 32.8 28.9 27.5 22.1 23.0 23.7 TOA's 15.8 15.0 1 1.1 8.1 7.5 7.4 8.0 Pl Spec/Psych/Social Wkr 57.9 54.9 50.3 22.0 12.7 34.2 40.0 Nurses 79.5 78.8 70.8 70.5 59.0 59.6 60.0 Office Specialists 46.0 37.5 34.4 31.5 24.4 23.5 23.7 Paraprofessionals 20.9 24.2 18.1 17.3 14.9 14.9 14.9 Other 47.9 45.6 33.0 31.6 35.9 69.3 40.3 Total 316.3 301.0 256.3 217.0 187.3 242.6 220.7 13
Position History 14 1 �
Position History Instructional Services by Category – Federal Funds Category 2007 2008 2009 2010 2011 2012 2013 Directors 1.4 1.4 2.2 2.2 2.2 1.7 1.9 Coordinators/Mgrs 5.4 5.4 7.1 8.4 14.1 13.8 13.6 Specialists/Facilitators 21.9 21.2 21.1 20.5 14.9 17.0 17.3 TOA's 55.3 61.6 59.6 54.5 57.1 53.2 38.0 Pl Spec/Psych/Social Wkr 13.6 16.6 17.7 46.0 42.3 20.8 31.0 Nurses - - - 0.8 - - - Office Specialists 35.8 36.3 36.3 37.5 37.8 37.2 34.1 Paraprofessionals 4.9 4.9 8.2 8.2 8.3 8.3 Other 34.7 35.9 35.9 37.7 41.7 32.6 36.2 Total 173.0 183.2 188.0 215.8 218.2 184.4 180.3 15
Position History FY13 Non-Classroom Teachers - All Funds 9% District Based - 9% School Based - 91% Artifact 4 91% 16
Position History FY13 Non-Classroom Teachers - District Based – All Funds 6% 3% 3% 3% ESE Behavior Spec 6% Family Support Spec 3% 50% District Homeless Liaison 3% STEM Coach 3% ESE TOA's 35% 35% TOA's 50% 1 �
Position History FY13 Non-Classroom Teachers-School Based-All Funds Instr Coaches 14% 14% 14% Intensive Teachers 7% 1% 7% Home/Hospital Tchr 2% 12% 2% Speech Clinician 11% Social Worker 3% Guidance 25% 11% 5% Placement Spec 6% Psychologist 5% Media 12% 6% 3% Diagnostic Teacher 1% TOA's 14% 25% 1 �
Position History FY13 Non-Classroom Teachers - School-Based – General Fund 4% 4% 12% 2% Instr Coaches 4% 16% Social Worker 4% 18% Home/Hospital Tchr 2% Speech Clinician 16% Guidance 36% Placement Spec 2% Psychologist 6% 6% Media 18% 2% 36% TOA's 12% � �
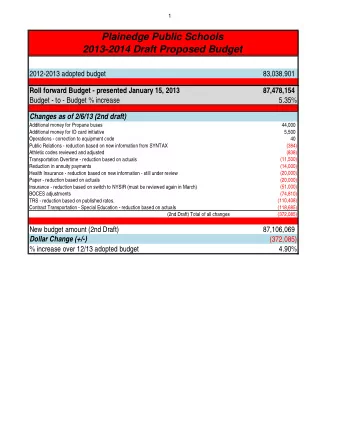
Department General Fund Budgets (Non ‐ Salary) 700,000 A 596,356 600,000 Decline of 57% 500,000 400,000 300,000 258,137 200,000 100,000 0 2006 ‐ 2007 2012 ‐ 13 20
7 ‐ Year General Fund History by Object (Non ‐ Salary ) 2012-2013 Budget Budget Budget Budget Budget Budget Budget % vs Object 2006-2007 2007-2008 2008-2009 2009-2010 2010-2011 2011-2012 2012-2013 Change 2006-2007 Professional & Technical Svc 42,300 42,300 42,300 5,100 3,000 4,000 4,000 (38,300) -91% Travel 202,363 231,366 211,508 156,017 155,359 155,176 151,710 (50,653) -25% Service Contracts 21,450 21,600 20,600 7,847 10,642 11,642 10,732 (10,718) -50% Maintenance & Repairs 14,438 14,438 12,938 3,450 3,450 3,450 3,450 (10,988) -76% Rental – Other 10,869 14,369 14,369 4,769 2,419 2,419 2,419 (8,450) -78% Postage 14,033 14,033 11,204 33 233 300 300 (13,733) -98% Printing 25,159 22,259 17,105 6,397 6,705 4,105 3,830 (21,329) -85% Misc. Other Purchased Svc 29,349 29,279 25,627 23,027 227 0 0 (29,349) Supplies 147,697 113,669 98,299 46,419 56,201 55,815 59,933 (87,764) -59% Periodicals 15,800 15,800 15,800 10,878 8,640 8,197 7,480 (8,320) -53% Capital Outlay 0 0 0 0 0 8,300 8,300 8,300 Dues & Fees/Other 72,898 54,680 50,480 3,515 3,139 6,157 5,983 (66,915) -92% Totals 596,35 6 573,793 520,230 267,452 250,015 259,561 258,137 (338,219) -57% 21
Curriculum Project General Revenue Budgets 22
Curriculum Project General Revenue Budgets This list represents examples of projects included in this category over the past 7 years. Eliminated African American Studies Family & School Partnership AV Repair Musical Instrument Repair Closure of Adjunct Facilities: Performing Arts/Lively Arts Center •Bicentennial Youth Park Professional Development – Teacher Training •Museum of Arts & Science Reading 6-12 – Secondary Writing Support •Pioneer Arts Settlement Safe Schools – Project Harmony College Expo Superintendent’s Scholars Course Retrieval Labs Technology Training Curriculum Development/Mapping Theater Performances Education Partners Development Very Special Arts Festival Elementary Math Tutoring Volusia County Behavioral Initiatives ESOL Certification Workshops 23
Curriculum Project General Revenue Budgets This list represents examples of projects included in this category over the past 7 years. Maintained Reduced Advanced Placement AVID RtI Initiative—Multi -Tiered System of Supports Benchmark Assessment Development Career and Technical Education Effective Schools High School Showcase Shifted K-12 Art Supplies AVID Math Manipulative PRISM Student Teacher Recognitions Superintendent Diploma of Distinction Targeted Instruction Initiatives New Testing Supplies E3 Two Year Mentoring Supplemental Gifted Artifact 5 24
Curriculum Development & School Improvement Administration General Revenue Budget 25
26
Curriculum Development & School Improvement Services General Revenue Budget 27
K-12 Curriculum Major Responsibilities Elementary Curriculum Develop curriculum, assessments, and resources for core content Provide support for implementation of curriculum at the elementary schools District lead for professional development on common core Manage and monitor the Southern Association of Colleges and Schools / Council on Accreditation and School Improvement (SACS/CASI) accreditation process for all schools Facilitate collaboration between departments for support of elementary schools Support the schools designated as one of the state determined Lowest 100 Performing Elementary Schools � �
Recommend


More recommend
Explore More Topics
Stay informed with curated content and fresh updates.