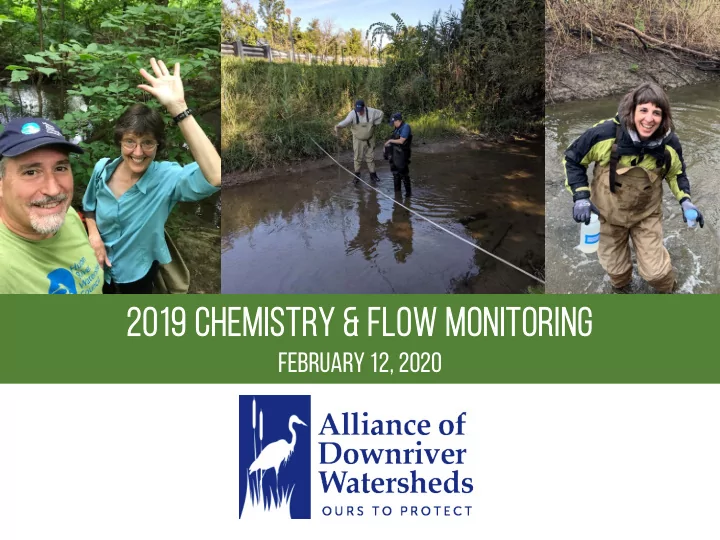

201 019 C 9 CHEMISTR HEMISTRY Y & & FL FLOW MONITOR OW MONITORING ING February 12, 2020
PROGRAM GOALS • Collect high-quality, scientific data on the local waterways. • Educated decision-makers and the public. • Provide necessary data for state stormwater permit reporting. • Engage members of the public in water resources & cultivate local water stewards. • Identify impaired areas, provide evidence for funding.
VOLUNTEER ROLES • Meet up in teams of 2-4 individuals. • Navigate to sites. • Collect water samples. • Measure in-stream water chemistry. • Record flow measurements. • Track water level changes. • Identify any areas of concern or illicit discharges. • Deliver samples to lab.
PARAMETERS measured • Nutrients: Phosphorus • Sediments: Total Suspended Solids • Bacteria: E. coli • Dissolved Oxygen • Temperature • Conductivity • Flow: Discharge • Water Level
2019 Program overview
Volunteer engagement review 20% 20% 40% 40% Downriver Volunteers Volunteer Hours 100% 100% 78% 95% 95% Are likely to Enjoyed the Are likely to recommend program return to the the program program to others
What did Volunteers enjoy about the program? #1 #1 Meeting new Spending time Contributing to an people in nature important issue Exploring Science and new areas data collection
2019 Wayne CO. MONITORING SITES 13 total sites 4 investigative sites
Phosphorus in the ADW over time 1.00 Total Phosphorus (mg/l) 0.10 0.01 TREND = PHOSPHORUS TARGET = 0.00 2016 2017 2018 2019
Phosphorus in the adw BY SITE (2019) 1.00 Total Phosphorus (mg/l) 0.10 0.01 PHOSPHORUS TARGET = 0.00 Frank & Poet Blakely Brownstown S. Ecorse N. Ecorse Woods Silver Smith Huron River
Phosphorus at the huron river in rockwood 1.00 Total Phosphorus (mg/l) 0.10 0.01 TREND = PHOSPHORUS TARGET = MEAN = MEDIAN = 0.00 2016 2017 2018 2019
Phosphorus at BLAKELY CREEK 1.00 Total Phosphorus (mg/l) 0.10 0.01 TREND = PHOSPHORUS TARGET = MEAN = MEDIAN = 0.00 2012 2013 2014 2015 2016 2017 2018 2019
phosphorus TRENDS in the adw • Statistically significant increase at Blakely Creek. • No statistically significant change in concentrations at Frank & Poet, Brownstown, S. Ecorse, N. Ecorse, Woods, Silver, and Smith Creeks, nor at the Huron River site.
E. coli in the adw over time 10,000 1,000 E. coli (#/100 ml) 100 10 TREND = PARTIAL BODY CONTACT STANDARD = FULL BODY CONTACT STANDARD = 1 2016 2017 2018 2019
e. cOLI in middle huron BY SITE (2019) 100,000 10,000 E. coli (#/100 ml) 1,000 100 10 PARTIAL BODY CONTACT STANDARD = FULL BODY CONTACT STANDARD = 1 Frank & Poet Blakely Brownstown S. Ecorse N. Ecorse Woods Silver Smith Huron River
e. cOLI at frank & Poet drain 100,000 10,000 1,000 E. coli (#/100 ml) 100 10 1 TREND = PARTIAL BODY CONTACT STANDARD = FULL BODY CONTACT STANDARD = 0 2012 2013 2014 2015 2016 2017 2018 2019
e. cOLI at BROWNSTOWN CREEK 100,000 10,000 1,000 E. coli (#/100 ml) 100 10 1 TREND = PARTIAL BODY CONTACT STANDARD = FULL BODY CONTACT STANDARD = 0 2012 2013 2014 2015 2016 2017 2018 2019
e. cOLI at S. Ecorse Creek 100,000 10,000 1,000 E. coli (#/100 ml) 100 10 1 TREND = PARTIAL BODY CONTACT STANDARD = FULL BODY CONTACT STANDARD = 0 2012 2013 2014 2015 2016 2017 2018 2019
e. cOLI at n. Ecorse Creek 100,000 10,000 1,000 E. coli (#/100 ml) 100 10 1 TREND = PARTIAL BODY CONTACT STANDARD = FULL BODY CONTACT STANDARD = 0 2012 2013 2014 2015 2016 2017 2018 2019
E. coli TRENDS in the adw • Statistically significant increases in E. coli at Frank & Poet, Brownstown, S. Ecorse, and N. Ecorse Creeks. • No statistically significant change in concentrations at Blakely, Woods, Silver, and Smith Creeks and the Huron River. • No declining trends.
Investigative differences at FRANK & POET DRAIN ADW01 Long Term 19% difference in TP -90% difference in E. coli ADW30 Investigative
Investigative differences at brownstown creek ADW03 Long Term 13% difference in TP -92% difference in E. coli ADW31 Investigative
Investigative differences at blakely creek ADW02 Long Term ADW32 Investigative -32% difference in E. coli 43% difference in TP 54% difference in TSS
Investigative differences at silver creek -61% difference in E. coli 40% difference in TP ADW33 2019 Investigative -32% difference in E. coli 38% difference in TP ADW26 2018 Investigative ADW08 Long Term
Ecorse creek Macroinvertebrates Spring Stream Quality Index Fall Stream Quality Index 60 60 50 50 40 40 30 30 20 20 10 10 0 0 2004 2007 2010 2013 2016 2019 2004 2007 2010 2013 2016 2019
Combined downriver Macroinvertebrates Spring Stream Quality Index Fall Stream Quality Index 60 60 50 50 40 40 30 30 20 20 10 10 0 0 2004 2007 2010 2013 2016 2019 2004 2007 2010 2013 2016 2019
NEXT STEPS • Follow up on findings • Develop online monitoring report. • Prepare for upcoming season • Identify new investigative sites . 2020 CHEMISTRY & FLOW MONITORING PROGRAM ORIENTATION Saturday, March 28, 2020 2:00 to 3:30 PM Riverview Veterans Memorial Library REGISTER AT: hrwc.org/chemflow PLEASE PROMOTE TO YOUR RESIDENTS!
Questions?
Recommend
More recommend