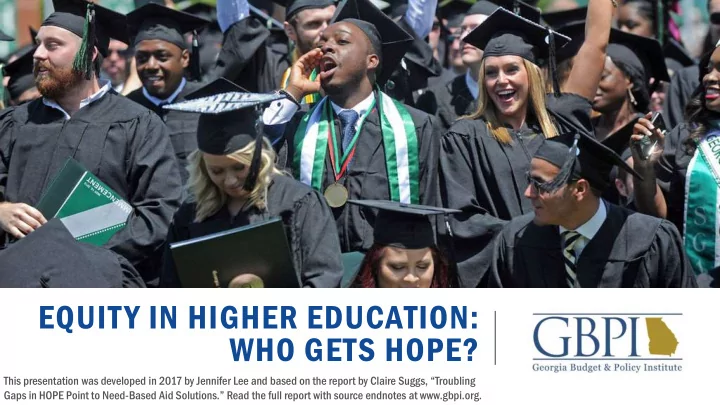

EQUITY IN HIGHER EDUCATION: WHO GETS HOPE? This presentation was developed in 2017 by Jennifer Lee and based on the report by Claire Suggs, “Troubling Gaps in HOPE Point to Need- Based Aid Solutions.” Read the full report with source endnotes at www.gbpi.org.
WHO WE ARE Nonpartisan, nonprofit state policy research Promoting broad economic opportunity Focus on state budget, taxes, education, health, safety net, jobs
HIGHER EDUCATION IS GOOD FOR STUDENTS, AND CRITICAL FOR GEORGIA’S FUTURE By 2020… Higher income 60 60 % of jobs will require Lower unemployment rates postsecondary ed 32 32 % Improves financial strength and stability will require at least a bachelor’s.
COMPLETE COLLEGE GEORGIA Goal: Increase postsecondary school graduates by 250,000 by year 2025
RACIAL & ECONOMIC EQUITY IN HIGHER EDUCATION IS CRITICAL TO GEORGIA’S SUCCESS Middle- and High-Income Students Low-Income Students Data for University System of Georgia. “Low - Income Students” are receiving Pell Grant.
RACIAL & ECONOMIC EQUITY IN HIGHER EDUCATION IS CRITICAL TO GEORGIA’S SUCCESS
THE “TYPICAL” GEORGIA PUBLIC COLLEGE EXPERIENCE • 50 institutions • Not just bachelor’s degrees • 29% Part-Time Enrollment
THE “TYPICAL” GEORGIA PUBLIC COLLEGE STUDENT Avg vg Age Gend nder Ra Race/Ethnic Ethnicity ity (Und (U ndergrad ad) 69% Female, 5% Hispanic, 6% Asian, 26 31% Male 61% Black, 21% White 31% Male, 7% Hispanic, 33% Asian, 20 69% Female 6% Black, 48% White
WHO PAYS FOR HIGHER EDUCATION? State investment down, tuition and fees up
WHAT’S THE BIG DEAL? Reduces college access Makes it more difficult to complete a degree Weakens financial security post-college
HOPE PROGRAMS Bachelor elors and As Associ ociates tes Degre grees Diplom omas and C Certi tificates icates University System* Technical College System* HOPE Zell Miller HOPE Grant Zell Miller Grant Scholarship Scholarship Partial Tuition Full tuition Partial Tuition Full Tuition *Small number (~2,000) of HOPE scholarships used at technical colleges for associates degrees.
HOPE PROGRAMS Bachelor elors and As Associ ociates tes Degre grees Diplom omas and C Certi tificates icates University System* Technical College System* Zell Miller HOPE Scholarship HOPE Grant Zell Miller Grant Scholarship 3.0 GPA + 3.7 GPA + 4 rigorous 4 rigorous courses + 2.0 GPA 3.5 GPA courses 1,200 SAT/26 ACT *Small number (~2,000) of HOPE scholarships used at technical colleges for associates degrees.
Most students don’t receive HOPE Scholarships Bachelor’s and Associate’s Degrees, University System *Small number (~2,000) of HOPE scholarships used at technical colleges for associates degrees. Data from Fall 2013
Middle- and high-income students more likely to receive HOPE Scholarships Bachelor’s and Associate’s Degrees, University System *Small number (~2,000) of HOPE scholarships used at technical colleges for associates degrees. Data from Fall 2013. “Low - income” students are receiving Pell Grant.
Middle- and high-income students much more likely to receive Zell Miller Scholarships Bachelor’s and Associate’s Degrees, University System *Small number (~20) of Zell Miller scholarships used at technical colleges for associates degrees. Data from Fall 2013. “Low - Income” students are receiving Pell Grant.
HIGH LEVEL OF UNMET STUDENT FINANCIAL NEED 112, 2,256 256 stu tudents dents $8 $808 08 mi mill llion ion Data for University System of Georgia, 2014-2015 academic year
STUDENTS ACROSS INCOME DO NOT RECEIVE HOPE, LOW-INCOME STUDENTS LESS LIKELY Bachelor’s and Associate’s Degrees, University System Data from Fall 2013. “Low - Income Students” are receiving Pell Grant.
STUDENTS ACROSS RACE/ETHNICITY DO NOT RECEIVE HOPE, BLACK STUDENTS LEAST LIKELY Bachelor’s and Associate’s Degrees, University System Data from Fall 2013
BLACK STUDENTS UNDERREPRESENTED IN ZELL MILLER SCHOLARS Data from Fall 2013
7-YEAR POST-HIGH SCHOOL TIME LIMIT RESTRICTS HOPE SCHOLARSHIP Potentially ineligible: • 12% of undergrads in university system (age 25+) Data from 2015
7-YEAR POST-HIGH SCHOOL TIME LIMIT RESTRICTS HOPE SCHOLARSHIP Potentially ineligible: • 60% of associate degree students in technical colleges (age 24+) Data from 2015
WHO GETS HOPE? • Most students do not receive HOPE • Less likely to receive HOPE: low-income students, Black students • 60% of associate’s degree student may be ineligible
MOST STUDENTS IN CERTIFICATE & DIPLOMA PROGRAMS RECEIVE HOPE GRANT Certificates and Diplomas, Technical College System Data from Fall 2013
WHO RECEIVES HOPE GRANT? Certificates and Diplomas, Technical College System 85% of low-income students Majority of students in all age groups Racial/ethnic makeup mirrors total technical college enrollment Data from Fall 2013
HOPE GRANT TIMELINE Legislatures Legi gislatur slature e cuts resets GPA Legislature HOPE PE Grant, t, raises ses requirements, creates Zell HOPE Grant GPA A requireme uirement nts keeps cuts Miller Grant created 2013 2011 2014
RECENT CHANGES TO HOPE SCHOLARSHIP Added HOPE requirement: 2011: 3.0 GPA + Legislature reduces HOPE Scholarship award. 4 “rigorous courses” Creates separate Zell Miller Scholarship with higher (AP, IB, other advanced courses) GPA + SAT/ACT requirement
IS HOPE ENOUGH?
POLICY RECOMMENDAT ATIONS Restore HOPE Grant to full tuition and fees for technical colleges. Eliminate time limit on HOPE Scholarship. Create a state aid program that takes into account students’ and families’ financial need.
The “college -for- all” movement in the U.S. has succeeded in broadening opportunities for all kinds of people. It’s amazing that people who grew up homeless find their way to college today. What’s not amazing is our inability to revise the American financing system of higher education to match those desires and expectations. - Dr. Sara Goldrick-Rab Professor of Higher Education Policy and Sociology, Temple University
This presentation was developed in 2017 by Jennifer Lee and based on the report by Claire Suggs, “Troubling Gaps in HOPE Point to Need - Based Aid Solutions.” Read the full report with source endnotes at www.gbpi.org. FOR MORE INFORMATION & TO STAY INVOLVED, SIGN UP FOR GBPI’S EMAIL LIST WWW.GBPI.ORG Taifa Butler, Executive Director tbutler@gbpi.org @taifabutler Jennifer Lee, Policy Analyst jlee@gbpi.org @jjesunlee Georgia Budget & Policy Institute www.gbpi.org @gabudget
Recommend
More recommend