
What’s trending in Image-Assisted Dietary Assessment (IADA) T echnology? Mary Cluskey, PhD, RD Erica Howes, MS Carol Boushey, PhD, RD
Dietary Assessments Standard tool for the evaluation of individual intake in the practice of nutrition and dietetics Nutrition research dependent upon dietary intake data for clinical trials Basis from which we form our understanding of population based intake studies (NHANES) and ultimately policy
Traditional methods and steps of DA Intake recording/measurement procedures ◦ Dietary record-the gold standard in traditional ◦ 24 hr. recall aka diet history ◦ FFQ or other survey Specifically recall/record foods for amount and type, including ingredient variations Transcribe those into a dietary data base, either by RDNs, trained analyst or subjects themselves
Limitations of DA All traditional DA methods have been shown to reveal inaccuracies in intake. Subjects ability to remember and/or report intentional bias into recall contributes to misreporting and error Expensive and incredibly time consuming and challenging to transfer information into databases. Other subject related limitations include the inconvenience, forgetting, lack of familiarity with foods and inherent ingredients, and with portions, and delays between consumption and the act of recalling/recording intakes
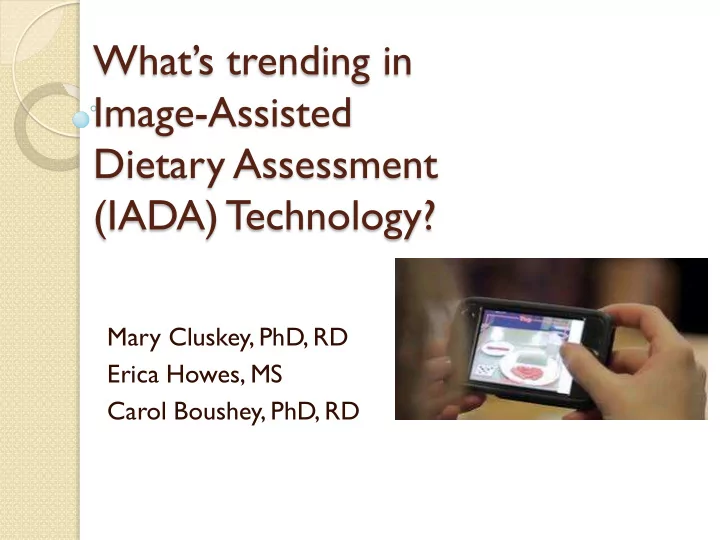
Developments in capturing images PDA, mobile phone apps, interactive software, camera and tape recorder, scan and sensor based technologies allowing for real time recording of food intake Other forms of /additions to imaging capturing, ◦ Intake can be voice to text recording, photographing food label or bar codes ◦ Reference item for color/size adjustment inserted into photo ◦ Subject to separate items on plate for taking images ◦ Text reminders to alert to send images ◦ Confirmation back to subject of correct entry ◦ Subject voice records food item detail
Active methods of image capture Challenges associated with capturing images ◦ Require before and after photo ◦ Poor color or light, unclear photo ◦ Need to stand and take food images at a 45°angle ◦ Difficult to get all foods into a photo ◦ Fail to capture quick meals Challenges with interpreting the photos ◦ Inability to discern hidden foods or ingredients ◦ Amorphous shapes and foods with similar appearance are difficult to interpret serving size ◦ Foods can look alike in images ◦ Screens used for viewing images impact quality
Passive methods of image capture Wearable camera Takes image every 20 seconds (2,000/day) Compensates for forgetfulness Records non-food information Privacy and awkwardness concerns Newer: Worn on ear and turns on with chewing Laboratory for Computational Neuroscience, Bioengineering, University of Pittsburgh, Pittsburgh, PA)
Research on image capture: Pilot testing Pilot studies have explored technology challenges and user friendliness of image capture Improved ease for subjects in recording intakes ◦ Images easier transfer of data to databases ◦ Intake collection error may be less than that resulting from asking subjects to recall and report Limited work to determine the level of improved accuracy of subjects’ actual intakes Early evidence that under-reporting with children is improved
TADA: T echnology assisted dietary assessment
OSU Research: Can dietitians (dietetics students) interpret food images Study conducted to explore skills needed, and identification and quantification ability of nutrition and dietetics students N~110, juniors/seniors/interns at 4 universities (US and Australia) Identification foods in images with a mean accuracy of 79.4% (66-97% range) With the exception of one food, the caloric difference by error represented +/- 4 kcal difference Quantification of foods represented a mean accuracy of 35.3% with a wider range and greater kcal differences
Associations between skills and image interpretation ability? Training and experiences that facilitate ability: ◦ Hands-on food training improves serving size estimation ◦ Calculations and food unit conversions ◦ Measuring and preparing food and using recipes ◦ Use of recipe/menu software programs and USDA FNDDS Limitations in interpretation ◦ Need greater familiarity with foods not typical in cultural group ◦ Standardizing portion terminology in FNDDS data base
Conclusions Image Assisted Dietary Assessment (IADA) Unclear if IADA improves accuracy of nutrient intakes Easier for client in keeping food intake information; this may result in greater compliance and less error Random coding errors with TADA will be less likely to result in errors from biased misrepresenting of dietary intake Subjects prefer technology based methods, especially younger subjects-make is simple and uncomplicated Learning to interpret IADA will mean hands-on training with foods and preparation for dietitian/nutritionists
Try the survey
References Zagat. https://www.zagat.com/b/national-dining-trends-survey-social-media- habits-viral-foods-and-more. . Accessed 2/22/2017. Menu Log Blog https://www.menulog.com.au/blog/social-media-changing- eat/. Accessed 2/22/2017. Gemming, L.; Utter, J.; Ni Mhurchu, C. Image-assisted dietary assessment: A systematic review of the evidence. J. Acad. Nutr. Diet 2015, 115, 64–77. Zhu F, Bosch M, Boushey C, Delp E. An image analysis system for dietary assessment and evaluation. Proc Int Conf Image Proc. 2010 : 1853–1856. doi: 10.1109/ICIP.2010.5650848 Illner AK, Freisling H,Boeng H, Huybrechts J Crispim SP , Slimani N. Review and evaluation of innovative technologies for measuring diet in nutritional epidemiology. Intl Jrnl of Epid. 2012:41:1187-1203. Howes E, Boushey CJ, Kerr DA, Tomayko EJ, Cluskey M. Image-based dietary assessment ability of dietetic students and interns. Nutrients.2017: 9 (2), 114; doi:10.3390/nu9020114
Recommend
More recommend