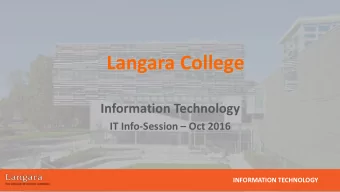
Who we are? • Utility Regulation • Public Advocacy • Engineering • Renewable Energy • Connectivity • Consumer Affairs dor'...-, 1 ?VERMONT IIENNITMENT Of PUILIC Klelf ICE 2016 Vermont Comprehensive Energy Plan
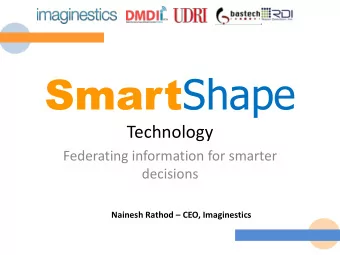
-6 '°" . A lib t l g 2.41F ir4=11 -11 - 11 o B r o A lcIP a n cJ• 41 - • 0 11 , 4 4• 4 a Traditional Telephony * 0 ilk 6 ipp p . irt � What is chan Inge Distributed rowitt Iforniorn.rra 0 inanimitslon Sviaisotior , • COMMERCIA, BUSINESS CON'
Gross Revenue Tax 2017 � 2018 FY 2016 - FY 2018 2015 � 2016 � 5,505,661 0.0% Electric 5,470,690 5,507,514 5,487,512 -19% Telephone 1,826,415 1,747,995 1,571,085 1,419,576 1,325,924 13% Cable 1,071,971 1,173,788 1,247,667 -13% Gas 347,410 358,143 302,912 310,285 Water 1,549 1,304 1,181 1,008 -23% Total 8,562,453J -2.6% 8,718,035 8,788,743 8,610,357 Department 5,230,821 5,273,246 ' 5,166,214 5,137,472 Public Utilty Commission 3,444,143 , 3,424,981 3,487,214 3,515,497
Gross Receipts Tax Revenue 2002-2018 $9,000 1 000 $8,000,000 $7,000,000 $6 1 000,000 $5,000,000 $4,000,000 $3,000,000 $2,000,000 $1,000,000 2002 2003 2004 2005 2006 2007 2008 2009 2010 2011 2012 2013 2014 2015 2016 2017 2018 Gas —Water Total in—ms Electric —Telephone — Cable �
Public Service Department Adjusted Expenditures* vs Revenues FY 2013 - FY 2022 6 , 500,000 6,000,000 1 5,500,000 5,000,000 4,500,000 4,000,000 Fr 2013 Fe2014 Fe2015 FT2016 Fr2017 Pf'2018 Fr2019 Fr2020 Ff'2021 FY 1 2022 * Reflects 2djustments to expenditures for � ommi Total PSI) Exp.. Projections Total PSI) Expenditures � one-time reimbursed expenses � -PSD Revenue � PSD Revenue Projections • �
Recommend
More recommend
Unleash a World of Digital Possibilities—Browse, Share, and Explore Content Without Boundaries