What are Programming Tools? Programs and applications that help - PDF document
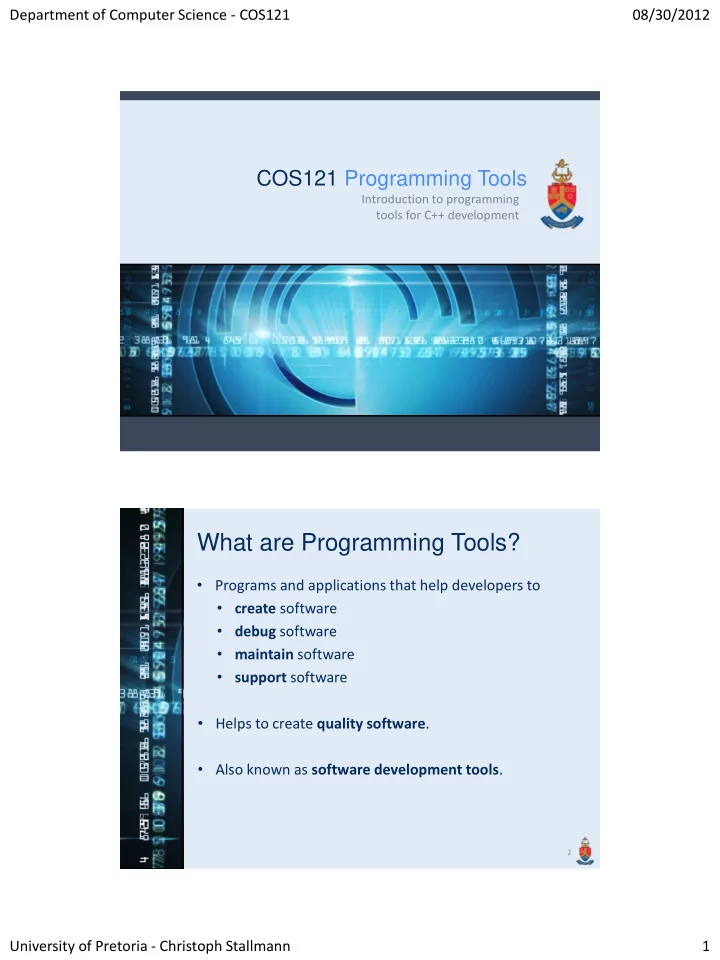
Department of Computer Science - COS121 08/30/2012 COS121 Programming Tools Introduction to programming tools for C++ development What are Programming Tools? Programs and applications that help developers to create software debug
Department of Computer Science - COS121 08/30/2012 COS121 Programming Tools Introduction to programming tools for C++ development What are Programming Tools? • Programs and applications that help developers to • create software • debug software • maintain software • support software • Helps to create quality software . • Also known as software development tools . 2 University of Pretoria - Christoph Stallmann 1
Department of Computer Science - COS121 08/30/2012 Qt - The Mother of all Frameworks • Qt is a cross-platform application framework written in C++. • Cross-platform : Windows, Mac, Linux, Android, iOS , … • Created by Trolltech (1991), bought by Nokia (2008), moved to Digia (August 2012). • Qt version 5 ( Qt 5 ) should have been released in August 2012. • Qt uses design patterns extensively. 3 Qt - The Mother of all Frameworks • All though Qt is written in C++ there are numerous bindings available: • Java (Qt Jambi) • PHP (PHP-Qt) • C# (Qyoto and qt4dotnet) • Ada (QtAda) • Python (PyQt, PySide and PythonQt) • Ruby (QtRuby) • Perl (PerlQt4) • Lisp (CommonQt) • Many more … 4 University of Pretoria - Christoph Stallmann 2
Department of Computer Science - COS121 08/30/2012 Qt - The Mother of all Frameworks • Qt provides extensive and advanced programming tools : • GUI design (Qt Designer) • IDE (Qt Creator) • Debugging (integrated Qt debugger) • Build Automation (qmake, uic and rcc) • Simulations (Qt Simulator) • Advanced XML support (QML) • Language translation (Qt Linguist) 5 Qt - The Mother of all Frameworks • Qt is used by many applications and companies: • VLC media player • VirtualBox • Google • Walt Disney Animation Studio • DreamWorks • European Space Agency • Skype • Adobe Photoshop • Opera • Volvo • Siemens • Many more … 6 University of Pretoria - Christoph Stallmann 3
Department of Computer Science - COS121 08/30/2012 Categories • Compilers • Build Automation • Profilers • Integrated Development Environments (IDEs) • Graphical User Interface (GUI) Designers • Debuggers 7 Compilers • Computer programs that transform source code into computer code (eg: binary). • Source code is written in a specific programming language . • Example C++ compilers: • GCC/G++ (Linux & Mac) • MinGW (GCC for Windows) • Bloodshed Dev-C++ (Windows) • Visual C++ (Windows) • Borland C++ (Windows) • Many more … 8 University of Pretoria - Christoph Stallmann 4
Department of Computer Science - COS121 08/30/2012 Build Automation • Programs that automate the compiling , linking and deployment process of software. • Often automates makefile generation. • Examples: • CMake (Windows, Linux & Mac) • Qt’s qmake (Windows, Linux & Mac) • GNU’s Automake (Windows, Linux & Mac) • Microsoft’s nmake (Windows) • Many more … 9 Profilers • Programs used to dynamically analyse software. • Measures the space and time complexity of programs: • Memory usage • Disk space requirements • Execution time • Mainly used for program optimization. • Examples: • Apple’s Shark (Mac) • oprofile (Linux) • AMD’s CodeAnalyst (Linux) • .NET’s profiler (Microsoft) • Many more … 10 University of Pretoria - Christoph Stallmann 5
Department of Computer Science - COS121 08/30/2012 Integrated Development Environments • Commonly known as IDE s. • A software application that provides a comprehensive programming and development facility . • Often consists of: • Source code editor • Build automation and compiler • Debugger • Examples: • Qt Creator (Windows, Linux & Mac) • Visual Studio (Windows) • Dev-C++ (Windows) • Xcode (Mac) • Many more … 11 IDE – Qt Creator 12 University of Pretoria - Christoph Stallmann 6
Department of Computer Science - COS121 08/30/2012 IDE – Visual Studio 13 IDE – Xcode 14 University of Pretoria - Christoph Stallmann 7
Department of Computer Science - COS121 08/30/2012 IDE – Dev-C++ 15 Graphical User Interface Designers • A software application that provides functionality for designing graphical user interfaces (GUIs). • They are often based on the drag-and-drop principle. • Examples: • Qt Designer (Windows, Linux & Mac) • Visual Studio (Windows) • Xcode (Mac) • Many more … 16 University of Pretoria - Christoph Stallmann 8
Department of Computer Science - COS121 08/30/2012 GUI Designer – Qt Designer 17 GUI Designer – Visual Studio 18 University of Pretoria - Christoph Stallmann 9
Department of Computer Science - COS121 08/30/2012 GUI Designer – Xcode Designer 19 Debuggers • Programs used to test and debug a target program. • Mostly used to find the reason for a program misbehaviour or crash . • Examples: • GNU’s Debugger (Windows, Linux & Mac) • WinDbg (Windows) • Qt’s Debugger (Windows, Linux & Mac) • Visual Studio Debugger (Windows) • Many more … 20 University of Pretoria - Christoph Stallmann 10
Department of Computer Science - COS121 08/30/2012 GDB - The GNU Project Debugger • Allows you to see what is going on inside another program. • Helps to detect program crashes such as Segmentation Faults (SegFaults). • Supports back tracing . • Supports manual manipulation of breakpoints . • Helps with the stack inspection . • http://www.gnu.org/software/gdb 21 GDB – Installation • Ubuntu/Debian: • sudo apt-get install gdb • Fedora/RedHat: • sudo yum install gdb • Windows: • Use MinGW • http://www.mingw.org 22 University of Pretoria - Christoph Stallmann 11
Department of Computer Science - COS121 08/30/2012 GDB – Debugging a Program • When compiling with gcc/g++ use the – g flag : • Eg: g++ -c -g main.cpp • You can also add – g to your makefile. • Tells g++ to create internal debug information and symbols. • Once compiled, run gdb on your executable: • Eg: gdb program • program is the name of the executable. 23 GDB – Debugging a Program 24 University of Pretoria - Christoph Stallmann 12
Department of Computer Science - COS121 08/30/2012 GDB – Navigation Commands • To run the program: • run or r • To start a step-wise debugging process: • start • To stop a step-wise debugging process: • stop 25 GDB – Navigation Commands • To continue by taking a single step: • step or s • To continue to the next breakpoint: • continue or c • To back trace after an error: • backtrace • To exit gdb: • quit or q 26 University of Pretoria - Christoph Stallmann 13
Department of Computer Science - COS121 08/30/2012 GDB – Breakpoint Commands • To add a breakpoint at a specific line: • break <line number> • b <line number> • Eg: break 16 • To add a breakpoint at a specific function: • break <function name> • b <function name> • Eg: break main • Eg: break Student::print 27 GDB – Breakpoint Commands • To add a breakpoint at a specific line in a specific file: • break <file name>:<line number> • b <file name>:<line number> • Eg: break student.cpp:32 • To view all breakpoints: • info breakpoints 28 University of Pretoria - Christoph Stallmann 14
Department of Computer Science - COS121 08/30/2012 GDB – Example 29 GDB – Alternatives • GNU DDD – GNU graphical front-end to GDB. • Nemiver – Gnome graphical front-end to GDB. • Qt Creator – Integrated debugger in Qt Creator. • Visual Studio – Integrated debugger in Visual Studio. • Xcode – Integrated debugger in Xcode • WinGDB – GDB implementation for Windows. • KGDB – Debugger for the Linux kernel. • Eclipse – CDT integrated in Eclipse. 30 University of Pretoria - Christoph Stallmann 15
Department of Computer Science - COS121 08/30/2012 Valgrind • Allows you to analyse memory management and threading bugs . • Has characteristics of a debugger and profiler . • Mainly use to detect memory leaks . • Memory leaks are chunks of memory that are allocated by a program but can’t be accessed at a later stage or returned back to the operating system. • http://valgrind.org 31 Valgrind – Installation • Ubuntu/Debian: • sudo apt-get install valgrind • Fedora/RedHat: • sudo yum install valgrind • Windows: • Not officially supported. • Use Valgrind4Win • http://sourceforge.net/projects/valgrind4win 32 University of Pretoria - Christoph Stallmann 16
Department of Computer Science - COS121 08/30/2012 Valgrind – Debugging a Program • When compiling with gcc/g++ use the – g flag : • Eg: g++ -c -g main.cpp • You can also add – g to your makefile. • Tells g++ to create internal debug information and symbols. • Once compiled, run valgrind on your executable: • Eg: valgrind ./program • program is the name of the executable. 33 Valgrind 34 University of Pretoria - Christoph Stallmann 17
Recommend
More recommend
Explore More Topics
Stay informed with curated content and fresh updates.
