WebRTC 1. Sampling Measures samples a. 2. Structural Measures time - PowerPoint PPT Presentation
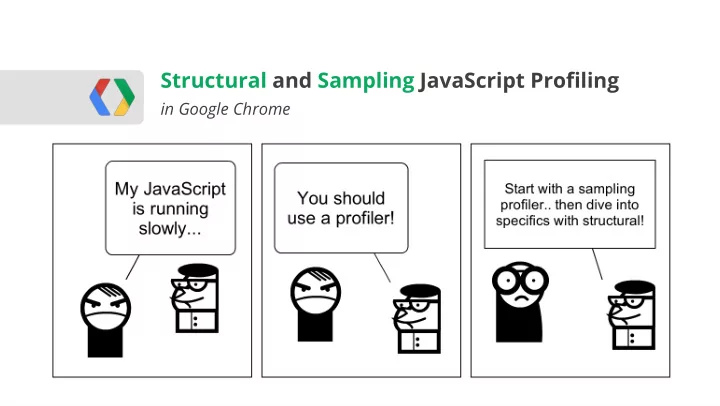
Structural and Sampling JavaScript Profiling in Google Chrome WebRTC 1. Sampling Measures samples a. 2. Structural Measures time a. aka, instrumenting / markers / inline b. Sampling CPU Profilers At a fixed frequency: Instantaneously pause
Structural and Sampling JavaScript Profiling in Google Chrome WebRTC
1. Sampling Measures samples a. 2. Structural Measures time a. aka, instrumenting / markers / inline b.
Sampling CPU Profilers At a fixed frequency: Instantaneously pause the program and sample the call stack function foo() { bar(); } function bar() { SAMPLE 0: bar } 1: foo foo(); 2: program
Sampling CPU Profilers ??? ??? ??? ??? ??? ??? ??? ??? ??? 1ms Assumption: our sample is representative of the workload data sampled on a 1 ms interval in Chrome ● collect data for longer period of time ● ensure that your code is exercising the right code-paths ●
Sampling CPU Profilers Samples are processed and outputs two data points per function: Percentage of samples function was leaf of a call stack 1. Analogous to exclusive time a. Percentage of samples function was present in call stack 2. Analogous to inclusive time a. function foo() { exclusive 0: bar bar(); } inclusive 1: foo function bar() { 2: program SAMPLE } foo();
Structural CPU Profilers Functions are instrumented to record entry and exit times. function foo() { Buffer bar(); } Enter Foo #TS0 Enter Bar #TS1 function bar() { Exit Bar #TS2 } Exit Foo #TS3 foo(); Structural execution trace
Structural CPU Profilers Buffer is processed and outputs three data points per function: Buffer 1. Inclusive Time Enter Foo #TS0 a. Time function was running for including time spent inside children . Enter Bar #TS1 2. Exclusive Time Exit Bar #TS2 a. Time function was running for excluding time spent inside children . Exit Foo #TS3 3. Call Count Structural a. Number of times the function was called. execution trace
JavaScript optimization: the quest to minimize the inclusive time of a function. * aka, including time spent inside children
Which should I use? ... Both! Sampling Structural / Instrumenting Time Approximate Exact Invocation count Approximate Exact Overhead Small High(er) Accuracy *** Good - Poor Good - Poor Extra code / instrumentation No Yes Instrumenting profilers requires that you.. instrument your code: ● Fine-grained control over what is being traced, but requires that you know what to trace ○ Platform code / API's out of reach ○ Sampling profilers require no instrumentation, but: ● Are an approximation of what is happening in your application ○ May miss or hide some code-paths ○ P.S. It's not either, or... you need both!
Sampling CPU Profiling in Chrome Built-in sampling CPU profiler in ... Profiles tab in Developer Tools! instantaneously pauses your code and samples the call stack ●
Sampling CPU profiling in Chrome Demo: V8 Benchmark Suite Heavy (bottom up view): functions by impact on performance + ability to examine the calling paths to each ● Tree (top down view): overall picture of the calling structure, starting at the top of the call stack ● Use " Focus selected function " to zero in on just the code you care about ● Chrome Developer Tools: CPU Profiling
Structural CPU Profiling in Chrome chrome://tracing is a power user structural profiler built for intrusive profiling of Chrome's internals ● most of this can and should be hidden for JavaScript profiling ●
How to use chrome://tracing to profile JavaScript... 1. You* must instrument your JavaScript code. function foo() { Some types of instrumentation: Manual ● console.time("foo"); Compiler / automatic tool ● bar(); Runtime instrumentation (ex. Valgrind) ● console.timeEnd("foo"); } "Trace macros are very low overhead. When tracing is not turned on, trace macros cost at most a few dozen function bar() { clocks. When running, trace macros cost a few thousand console.time("bar"); clocks at most. console.timeEnd("bar"); Arguments to the trace macro are evaluated only when } tracing is on --- if tracing is off, the value of the arguments don't get computed." foo(); WARNING: console.time and console.timeEnd spam the developer tools console. Keep it closed.
How to use chrome://tracing to profile JavaScript... 2. Start recording a trace 3. Interact with your application... 4. Head back, hit stop tracing Record on the order of a few to dozens of seconds of profiling data...
How to use chrome://tracing to profile JavaScript... 5. Behold the noise!
How to use chrome://tracing to profile JavaScript... 6. Find your page's process ID in chrome://memory 24454
How to use chrome://tracing to profile JavaScript... 7. Filter for the signal remove unnecessary threads and components ● click on "Categories" in top right, and filter down the list ●
How to use chrome://tracing to profile JavaScript... 8. Inspect the trace timeline, isolate your code... W A S D Remember your Quake keys? A - pan left D - pan right W - zoom in S - zoom out V8 execution ? - help
Let's do a walkthrough...
Hands on profiling... Let's assume the following scenario, with known exclusive run times... function gameloop(timestamp) { A(); requestAnimationFrame(gameloop); Function Exclusive Run Time } function A() { A() 2 ms spinFor(2); // loop for 2 ms B(); // Calls C B() 8 ms } C() 1 ms ... D() 2 ms function D() { Total 13 ms // Called by C spinFor(2); // loop for 2 ms }
Hands on profiling... Open up Profiles tab in Developer Tools, hit start, record, stop... Where is A(), B(), and C()? spinFor() is only in 0.96 % of the samples?! <facepalm> A() , B() , C() , and spinFor() were optimized and ultimately inlined into gameloop ! </facepalm>
Inlining is a common compiler optimization function gameloop(timestamp) { function gameloop(timestamp) { var x = 0; var x = 0; for ( int i = 0; i < 10; i ++ ) { for ( int i = 0; i < 10; i ++ ) { x = A(x); x = x + x; } } } } function A(x) { return x + x; } A() is erased when inlined into gameloop. Erased functions cannot show up in sampling profiler capture. ... Code in V8 != code in your source Performance tips for JavaScript in V8 - Chris Wilson
Chrome Developer Tools (Sampling) Profiler This trace does not resemble the application's actual execution flow or execution time. That's not to say that the sampling profiler is useless - to the contrary!
Hands on profiling... function A() { console.time("A"); spinFor(2); // loop for 2 ms Let's instrument our code with B(); // Calls C structural markers to help trace the console.timeEnd("A"); actual execution path } ... P.S. The functions can still be inlined, but so will our console statements! function D() { // Called by C console.time("D"); spinFor(2); // loop for 2 ms console.timeEnd("D"); } If you're wondering... there is ~0.01 ms of overhead per console call
Let's zoom in on the execution trace in chrome://tracing... Function Entry Time Exit Time Inclusive Runtime Exclusive Runtime A() 0 ms 13 ms 13 ms 2 ms B() 2 ms 13 ms 11 ms 8 ms C() 10 ms 13 ms 3 ms 1 ms D() 11 ms 13 ms 2 ms 2 ms
Hands on profiling conclusions... Sampling Profiler (Dev Tools) (in this case) did not present a clear picture of program execution flow or timings ○ Structural Profiler (chrome://tracing) Clearly showed program execution flow and timings ○ Required additional instrumentation ○
Real-world profiling workflow Realize JavaScript is running slow 1 Use sampling profiler to determine 2 where to add instrumentation Instrument and capture a trace 3 Optimize slowest region of code Rinse, lather, repeat...
A few closing tips... start with the sampling profiler... ● learn the navigation keys (WASD) for chrome://tracing ● filter down the recorded trace to process ID you care about ● console.{time, timeEnd} pairs can cross function boundaries ● Start with a large area of code and narrow with a binary search ! ○ Recall that V8 code != your source code ● That is, it's not necessarily the same... ○ You can save & load both types of profiling runs ● Attach them to your tickets, save for later, etc. ○
Think about the data being processed... Is one piece of data slower to process than the others? ○ Experiment with naming time ranges based on data name ○ VS
Planning for performance: allocate and follow a budget!!! Budget ● Each module of your application should have a time budget ○ Sum of all modules should be less than 16 ms for smooth apps ○ Track performance data daily (per commit?) ● Catch Budget Busters right away ○
Oh, and one more thing... Demo: determining frame rate in chrome://tracing
Questions! http://goo.gl/OSYJo
Recommend
More recommend
Explore More Topics
Stay informed with curated content and fresh updates.
