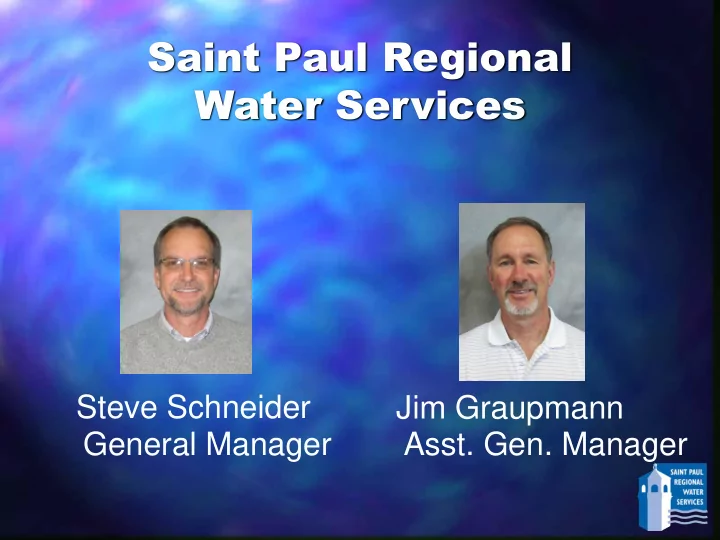

Saint Paul Regional Water Services Steve Schneider Jim Graupmann General Manager Asst. Gen. Manager
Facts and Figures Ave. day production 40 MG Population served 433,000 Accounts 95,460 Miles of water main 1,200 Hydrants 10,243 Tanks and reservoirs 20 Pumping stations 11
Organization Chart
Asset Management SPRWS water production and distribution assets are aging and much effort is spent on maintenance. Future improvements are needed to replace aging infrastructure and improve reliability & efficiency. Risk-based approach to asset management has been used. Risk = (consequence x likelihood) How severe are the How likely is it for consequences of asset failure? the asset to fail?
Current State of Buried Infrastructure 1,200 miles of water main 27% over 100 years old 43% over 80 years old 48% 6-inch diameter 70% cast iron (1960s or older) 100-150 main breaks per year 98% of main breaks are on cast iron mains
Factors Influencing Likelihood of Failure in Cast Iron Mains Year of install (not necessarily age) Diameter Length Prior breaks Storm sewer crossings Pressure/elevation Land use Pressure zone Proximity to tank Soil type
Master Plan for Production Assets Provides a road map of improvements needed over the next 40 years to maintain a reliable, viable utility. Anticipates future water demands and regulations that need to be met. Prioritizes the projects that are identified. Provides an implementation plan, with a schedule and cost elements.
Budget Considerations Board of Water Commissioners role. Decision made to invest now vs. later. Water treatment and supply. Water main replacements. Continue to create value for rate payers. Continued investment critical for success.
Additional Challenges Past Considerations Quantity drove system design. System was designed and built in an era of expanding population and water consumption. Water age in the system was not a design consideration. Few drinking water regulations looked at water in the distribution system.
Additional Challenges Future Challenges Quality & quantity drive system design. Due to lower per capita consumption, we need to reduce storage volumes and production rates. We know increased water age has a negative impact on water quality. More drinking water regulations are being applied to water quality in the distribution system (disinfection by- products, total coliform rule, lead and copper rule).
Additional Challenges: Cost and Coordination of Water Main Replacement Water main construction is coordinated with street reconstruction. Cost of utility work is highly dependent on restoration (street repair/construction). More arterial street restoration vs. residential street reconstruction. Changes in system demands.
Additional Challenges: Distribution Water Quality and Maintenance 43% of the system is more than 80 years old. Over half of the system is unlined cast iron pipe. Distribution maintenance: Uni-directional flushing Hydrant inspection Valve operation Break repair Etc.
Moving Forward Board of Water Commissioners are committed to continued investment. Over $325 million of investments are included in the 10-year capital plan. Funding is split between pay-as-you-go and debt. SRF funding will continue to be sought. Private service line replacement assistance may be necessary to address lead abatement.
Moving Forward Quality water production is a “forever” business. Success requires continued investment. Investment requirements need to be balanced with reasonable rates for service.
Recommend
More recommend