Water NMR for Protein Aggregation Characterization Marc Taraban - PowerPoint PPT Presentation
Water NMR for Protein Aggregation Characterization Marc Taraban Department of Pharmaceutical Sciences University of Maryland School of Pharmacy December 5, 2016, Baltimore Protein Aggregation Measurement in Biotherapeutics: Established and
Water NMR for Protein Aggregation Characterization Marc Taraban Department of Pharmaceutical Sciences University of Maryland School of Pharmacy December 5, 2016, Baltimore Protein Aggregation Measurement in Biotherapeutics: Established and Emerging Techniques
Water NMR—A Nuisance or A Tool? In aqueous solutions, solute resonances are considered the most important for NMR, and deuteration or suppression is used to remove interfering water signal BSA (15 mg/mL in PBS buffer) BSA (15 mg/mL in PBS buffer) without water suppression (1 with water suppression (100 scan): high S/N for narrow scans): bad resolution of water signal, protein protein resonances. resonances are invisible. Y. Feng, M. Taraban & Y.B. Yu (2015) Chem. Commun. 51, 6804
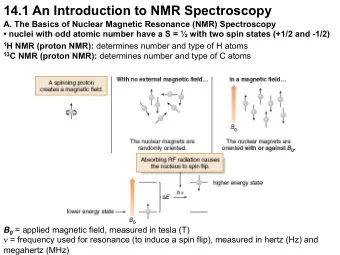
Relaxation Rates in NMR T 1 T 1 is spin-lattice or longitudinal relaxation, equal to time of energy transfer from excited to ground state along z -axis, often is defined by interaction between nucleus and media (solvent, diffusion). T 2 Relaxation of the nucleus to its ground state (aligned with external magnetic field) is controlled by T 2 is spin-spin or transverse relaxation, equal to time of two mechanisms. energy transfer within the nucleus in the xy -plane due to dephasing, NMR line broadening down to the disappearance of the NMR signal, often defined by dipolar interactions, anisotropy of molecule, etc. http://www.chem.ch.huji.ac.il
Transv ansver erse Relax se Relaxation of W tion of Water CPMG Pulse CPMG Pulse Seq Sequence uence R 2 ( 1 H 2 O) = 1/ T 2 T 2 is measured using classic CPMG pulse sequence that allows to monitor the drop in magnetization in xy -plane.
Water NMR—A Tool Water signal carries information on the global changes in the solute—water molecules interact with solute molecules and become sensitive to its changes, e.g., association R 2 ( 1 H 2 O), s -1 Shear Modulus G , kPa Water proton transverse relaxation rate, R 2 ( 1 H 2 O) , could be used to measure the stiffness of peptide-based hydrogel. Gelation and aggregation both involve association, so would R 2 ( 1 H 2 O) also be sensitive to protein aggregation? Y. Feng, M. Taraban & Y.B. Yu (2014) Chem. Commun. 50, 12120
Prior Art—Water Relaxation in Heat-Denatured Proteins Ovalbumin fresh; heat denatured (0.33 Tesla, 14 MHz 1 H) 10 1.6 0.106 s -1 .(mg/mL) -1 8 -1 0.014 s -1 .(mg/mL) -1 -1 1 H 2 O), s 1 H 2 O), s 1.2 6 4 0.8 R 1 ( R 2 ( 0.007 s -1 .(mg/mL) -1 2 0.4 0.004 s -1 .(mg/mL) -1 0 20 40 60 80 100 20 40 60 80 100 C, mg/mL C, mg/mL Does R 2 ( 1 H 2 O) correlate with aggregate size? Daszkiewicz et al. (1963) Nature, 200, 1006; Oakes et al. (1976) J. Chem. Soc. Faraday Trans. I 72, 228; Hills et al. (1989) Mol. Phys. 67, 903; Indrawati et al. (2007) J. Sci. Agric. 87, 2207 6
A Probe for Protein Aggregation Water proton NMR is sensitive towards heat-induced aggregation of BSA and human γ -globulin, and could be used to quantify protein aggregation γ -Globulin Bovine Serum Albumin 400 MHz 1.2 1.2 400 MHz 20 MHz R 2 ( 1 H 2 O), s -1 20 MHz 1.0 1.0 0.8 0.8 0.6 0.6 4 6 8 10 12 10 20 30 40 R h , nm R 2 ( 1 H 2 O) linearly increases with the growth of average hydrodynamic radius of protein aggregates. Similar sensitivity observed in high (400 MHz) and low-field (20 MHz, BT NMR) Y. Feng, M. Taraban & Y.B. Yu (2015) Chem. Commun. 51, 6804
Generation of Monoclonal Antibody Aggregates of various sizes mAb has been stressed by: Freeze-Thaw (-40°C 5°C, 16 cycles) Heating at 50°C (36 h) Agitation (24 h) Aggregation was studied by Conventional Techniques Size-Exclusion Chromatography (SEC) Dynamic Light Scattering (DLS) Micro-Flow Imaging (MFI) & Water NMR ( w NMR) Transverse Relaxation Rate of Water R 2 ( 1 H 2 O) Aggregates ≥ 5 µm Aggregates 0.45 to 5 µm Aggregates ≤ 0.45 µm
Measurement of mAb Aggregation by wNMR R 2 ( 1 H 2 O) responded to aggregate formation under different stresses and differs from control after filtration Freeze-Thaw 1.25 Heating Agitation 1.20 -1 1 H 2 O), s 1.15 R 2 ( 1.10 1.05 l d l d d d o o d l d d d d o e e e e e e e r r e r e r t r t r r r r r n e n r t e r e e e n e e e t e o o t t t t t t l l t o l t l l l l i i C i C i l i i i f l f C f i f f f i f n n f f n m m m m o m o m o N N N 5 5 5 5 5 5 4 4 4 . . . 0 0 0 R 2 ( 1 H 2 O) increased in each stressed sample compared to the unstressed • control sample Filtration reduced the increase in R 2 ( 1 H 2 O) for all stresses • R 2 ( 1 H 2 O) was still different after 0.45 micron filtration between stresses •
Measurement of mAb Aggregation by SEC 1000 % Low (LMW) and % High Molecular Weight (HMW) Control 800 and Total % soluble mAb aggregates for three stresses 600 mAU 400 5 m 0.45 m 200 Aggregates Control Nonfiltered filtered filtered 0 4 6 8 10 12 14 % LMW 0.8 7.4 7.3 7.3 Time, min Freeze- Control Thaw % HMW 0.0 1.9 2.0 2.0 1000 Freeze-Thaw Total % Aggr 0.8 9.3 9.3 9.3 Heating, 50°C 800 Agitation 600 % LMW 0.8 1.4 1.4 1.4 mAU Heating 400 50°C % HMW 0.0 6.5 6.4 6.4 200 0 Total % Aggr 0.8 7.9 7.8 7.8 4 6 8 10 12 14 Time (min) Stressed samples % LMW 0.6 3.2 3.2 3.4 Agitation % HMW 0.0 6.9 6.0 5.9 150 Freeze-Thaw Heating, 50°C Agitation Total % Aggr 0.6 10.1 9.2 9.3 100 mAU 50 Total percentage of aggregates were similar, but aggregate • profile was different between each stress type 0 4 5 6 7 8 5 µm & 0.45 µm filtration did not change the ratio between Time (min) • LMW and HMW aggregates or total percentage of aggregates Aggregates
Particle Concentration (#/mL) 10 10 10 10 10 10 1 2 3 4 5 6 • • 1 m Measurement of mAb Aggregation by MFI Control 2 m control After 0.45 µm filter, the samples for all three stresses are very close to the unstressed particles) 5 µm filtration reduced particle counts from ≥ 1 µm to ≥ 25 µm (not only for ≥ 5 µm 5 m 10 m 25 m Nonfiltered 1 m Freeze-Thaw 2 m 5 m 10 m 25 m 5 m filtered Decrease in particle counts during filtration from MFI 1 m 2 m 5 m 10 m 0.45 m filtered 25 m 1 m 2 m 5 m 10 m 25 m Particle Concentration (#/mL) 10 10 10 10 10 10 1 2 3 4 5 6 1 m Control 2 m 5 m 10 m Heating, 50 ° C 25 m Nonfiltered 1 m 2 m 5 m 10 m 25 m 5 m filtered 1 m 2 m 5 m 10 m 0.45 m filtered 25 m 1 m 2 m 5 m 10 m 25 m Particle Concentration (#/mL) 10 10 10 10 10 10 1 2 3 4 5 6 1 m Control Nonfiltered 2 m 5 m 10 m 25 m Agitation 1 m 2 m 5 m 10 m 25 m 5 m filtered 1 m 2 m 5 m 10 m 0.45 m filtered 25 m 1 m 2 m 5 m 10 m 25 m
Measurement of mAb Aggregation by DLS Each stress produced different particle size distributions (PSD) of aggregates Freeze-Thaw Heating 50°C Agitation 0.4 0.3 0.4 0.4 0.06 0.2 0.2 0.2 0.10 Nonfiltered 0.0 0.2 0.0 0.0 0.04 0 1 2 3 4 10 0 10 1 10 2 10 3 10 4 0 1 2 3 4 10 10 10 10 10 10 10 10 10 10 0.05 0.1 0.02 0.0 0.15 0.00 Intensity, arb. unit Intensity, arb. unit Intensity, arb. unit 5 µm filtered 0.4 0.10 0.05 0.2 0.05 0.4 0.2 0.10 0.45 µm filtered 0.2 0.1 0.05 0.0 0.0 0.00 0 1 2 3 4 0 1 2 3 4 0 1 2 3 4 10 10 10 10 10 10 10 10 10 10 10 10 10 10 10 R h , nm R h , nm R h , nm 5 µm and 0.45 µm filters had minimal effect on PSD for freeze-thaw and heating • Both filtration steps affected the PSD for agitation stress significantly •
Recommend


More recommend
Explore More Topics
Stay informed with curated content and fresh updates.