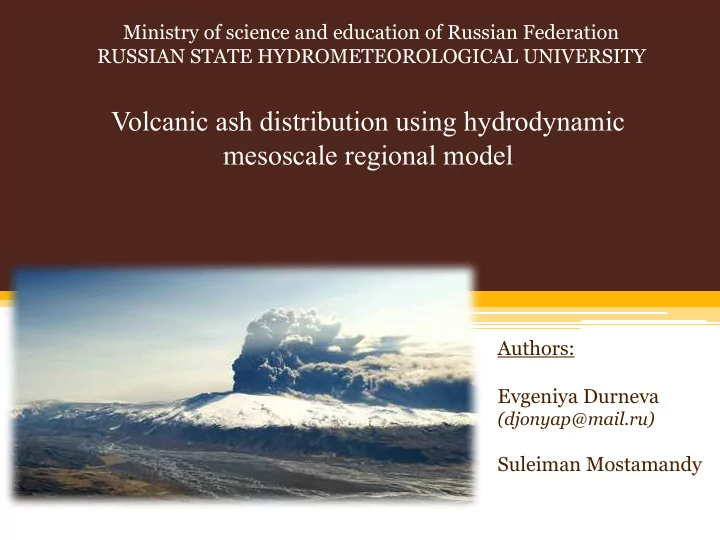

Ministry of science and education of Russian Federation RUSSIAN STATE HYDROMETEOROLOGICAL UNIVERSITY Volcanic ash distribution using hydrodynamic mesoscale regional model Authors: Evgeniya Durneva (djonyap@mail.ru) Suleiman Mostamandy
Objectives • Volcanic ash: impacts on climate change and aircraft; • Methods of volcanic ash observation; • Forecast of volcanic ash transport (case study: Eyjafjallajökull eruption in April 2010). http://www.aif.ru/society/
What is volcanic ash? • Volcanic ash consists of fine-grained rock, mineral fragments, and glass shards (less than 2 mm in diameter) generated during eruptions. (Stuefer, 2013) https:// www.meteoprog.kz/ru/news/45032 / Eruption of Krakatau, Nov 2010, Sergey Lyahovec
The largest volcanic eruption in XXI century
Role of the volcanic ash: Climate change • Change the gas composition of the atmosphere; • Increase the temperature of the atmosphere; • Decrease the solar radiation reaching Earth’s surface.
Role of the volcanic ash: Aircraft • Ash particles can abrade forward-facing surfaces, including windscreens, fuselage surfaces; • Ash contamination also can lead to failure of critical navigational and operational instruments; • Moreover, the melting temperature of the glassy silicate material in an ash cloud is lower than combustion temperatures in modern jet engines. http://edition.cnn.com/ http://www.thestar.com.my/news/
Satellite monitoring Single-channel imagery: • VIS channels, HRV (channel 12); • IR3.9 (reflected component), IR10.8. b a Comoros Islands. Ash plume in VIS channel (a) and IR3.9 channel (b) (Jochen Kerkmann)
Satellite monitoring Multi-channel imagery: 10.8 µ m – 12.0 µ m brightness temperature difference (BTD); • 3.9 µ m - 10.8 µ m BTD; • 10.8 µ m - 8.7 µ m BTD; • Volcanic ash Thin ice cloud (Ci) Comoros Islands. IR10.8 – IR12.0 (BTD) (Jochen Kerkmann)
Methods of forecasting • Synoptic method; • Hydrodynamic method – offline (HYSPLIT), online (WRF – Chem).
Structure of practical work • To use the WRF (ARW) model to get a standard set of data ( u and v components of wind speed); • To produce the best wind forecast by choosing the right Planetary Boundary Layer physics scheme in the WRF model; • To use these parameters as forcing in the HYSPLIT model.
Simulation area Simulation domain: • 300 × 200 grid cells, • 18 km resolution, • 35 sigma levels. Planetary Boundary Layer: • Asymmetric Convective Model version 2 (ACM2); • Bougeault-Lacarrere (BouLac); • Mellor-Yamada- Nakanishi-Niino (MYNN);
Sounding stations for estimation • Estimation from 15 April 12 UTC – 16 April 12 UTC; • Isobaric levels - 850, 700, 500, 300 hPa. Data provided by the http://weather.uwyo.edu
Estimation of wind speed and direction • ACM2 – data of wind speed (ff, m/sec) and direction (dd, grad.) • Actual data of wind speed (ff, m/sec) and direction (dd, grad.)
Estimation of wind speed and direction ff 850 hPa ff 700 hPa ff 500 hPa ff 300 hPa • absolute (abs) ACM2 abs rel cor abs rel cor abs rel cor abs rel cor 03005 0,57 0,57 0,86 1,80 1,80 0,85 2,92 2,92 0,60 0,08 0,08 0,80 error; 03238 0,36 0,36 0,18 -0,18 3,67 3,67 0,42 -0,42 01415 0,67 0,67 3,99 3,99 2,90 2,90 4,96 4,96 • relative (rel) error; 01241 1,53 -1,53 2,22 -2,22 3,48 -3,48 6,29 -6,29 10035 0,01 -0,01 0,39 -0,39 0,07 0,07 1,42 -1,42 • correlation (cor). 02527 4,65 4,65 9,48 9,48 20,93 20,93 10,47 10,47 02365 2,07 -2,07 2,38 2,38 10,95 -10,95 5,51 -5,51 02185 4,24 4,24 2,15 2,15 2,42 -2,42 11,08 -11,08 02963 2,55 2,55 0,45 0,45 1,04 -1,04 6,84 -6,84 26038 4,32 4,32 3,18 3,18 0,52 -0,52 13,71 13,71 10184 1,75 -1,75 0,57 -0,57 3,58 -3,58 3,27 3,27 12120 2,74 2,74 1,06 -1,06 2,08 -2,08 0,01 0,01 02591 1,01 1,01 4,77 4,77 0,19 0,19 5,74 5,74 26063 1,50 -1,50 1,05 -1,05 0,18 0,18 4,60 -4,60 dd 850 hPa dd 700 hPa dd 500 hPa dd 300 hPa ACM2 abs rel cor abs rel cor abs rel cor abs rel cor 03005 5,61 -5,61 0,98 5,02 -5,02 0,45 7,41 7,41 0,80 0,84 0,84 0,99 03238 0,52 0,52 339,28 339,28 9,77 -9,77 3,94 -3,94 01415 2,85 -2,85 9,95 -9,95 12,18 -12,18 13,75 13,75 01241 13,88 13,88 0,47 0,47 8,49 8,49 10,87 -10,87 10035 12,40 -12,40 16,75 16,75 26,86 26,86 24,92 24,92 02527 47,26 47,26 13,53 -13,53 29,49 -29,49 2,40 2,40 02365 9,77 -9,77 12,84 -12,84 2,16 -2,16 3,13 -3,13 02185 49,76 49,76 10,41 -10,41 27,07 -27,07 22,57 -22,57 02963 7,52 7,52 4,66 -4,66 43,23 -43,23 24,66 -24,66 26038 23,81 -23,81 47,89 -47,89 31,83 -31,83 3,37 -3,37 10184 14,09 -14,09 84,95 -84,95 23,16 -23,16 27,63 27,63 12120 5,05 5,05 226,08 226,08 242,06 242,06 1,09 -1,09 02591 29,86 -29,86 19,38 19,38 61,19 61,19 47,83 -47,83 26063 21,97 21,97 28,40 -28,40 4,30 -4,30 10,80 -10,80
Estimation of wind speed and direction Wind speed 300 hPa 16.04.2010 12 UTC 50,0 45,0 40,0 35,0 ff-pbl5 30,0 25,0 ff-pbl7 20,0 ff-pbl8 15,0 10,0 ff 5,0 0,0 Wind direction 300 hPa 15.04.2010 12 UTC 400 Wind direction grad. 350 300 250 dd-ACM2 200 dd-BouLac 150 100 dd-MYNN 50 dd-actual 0 Number of stations
Mass distribution of volcanic ash • A large volcanic plume has “umbrella” shape; • Linear distribution from the vent to the “umbrella”. LABEL Diameter Percent Release rate 75% P006 0.6µm 1% 0.008E+16 µg/m 3 P020 2.0µm 7% 0.068E+16 25% µg/m 3 P060 6.0µm 25% 0.250E+16 µg/m 3 P200 20.0µm 67% 0.670E+16 µg/m 3
BouLac ACM2 MYNN RGB satellite imagery; 15-16 April, 00 UTC
Further work • Use WRF-Chem model for future eruptions (Kamchatka Peninsula) Tolbachik volcano eruption, Kamchatka Peninsula
Conclusions • Results in this work showed that the WRF (ARW) as a hydrodynamic mesoscale model make a verisimilar forecast of main meteorological data; • Analysis of HYSPLIT pictures and satellite imagery showed that the HYSPLIT model with atmospheric forcing using BouLac parametrization gave more accurate estimation of ash trajectory and is more suitable to forecast the volcanic ash transport but insignificantly.
Thank You!
Recommend
More recommend