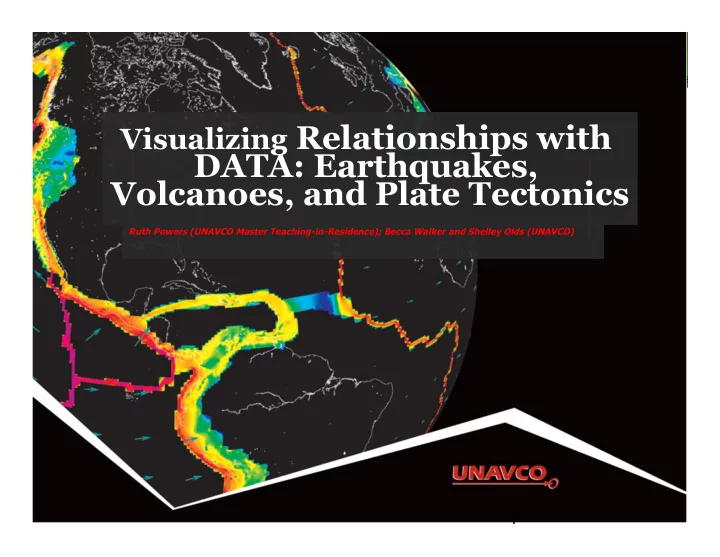

Visualizing Relationships with DATA: Earthquakes, Volcanoes, and Plate Tectonics Ruth Powers (UNAVCO Master Teaching-in-Residence); Becca Walker and Shelley Olds (UNAVCO) 1
Activity Outcomes Learners should be able to … • Explore & describe locations of earthquakes and volcanoes, and how they inform us about plate boundary zones • Compare plate motion between the Pacific Northwest and California based on crustal motion (from velocity vectors) • Describe the difference between a plate boundary and plate boundary zone • Determine plate boundary zones using multiple lines of evidence: GPS plate velocity vector maps, earthquake and volcano locations 2
Part 1: Prepare Your Map for Study Start at: http://www.unavco.org/ Click on Education then Interactive Data & Mapping Tools Click on EarthScope Voyager Jr . 3
Getting Oriented to the Map 4
Getting Oriented to the Map 5
Zoom Into the Western U.S. Click on map to zoom in Zoom into the United States Zoom into the Western United States 6
Add Political Lat/Long under Add Features Add political boundaries and latitude/longitude lines 7
Part 2: Compare Earthquake and Volcano Locations • Work with a partner • Follow the instructions: o Add your feature (hold ctrl- or command-key to keep the Political, Lat/Long ) o Study your map o Answer the questions o Draw the locations of your feature o Share your findings • Stop at Part 3 8
Earthquake and Volcano Distribution 9
Earthquakes and Volcanoes Discussion: A. What geographic features (mountains, plains, valleys, etc) are frequently where there are only: § Earthquakes? § Volcanoes? B. In which regions do you find earthquakes and volcanoes near each other? What ’ s there? C. Summarize the relationships you discovered. D. What explanation can you provide for the observed relationships? 10
Part 3: Examine GPS Vector Data GPS station positions change as plates move. B A How will GPS Station B ’ s position change relative to GPS Station A? GPS stations are not to scale 11
Part 3: Examine GPS Vector Data GPS station positions change as plates move. B A GPS Station B is moving toward A. GPS stations are not to scale 12
About Velocity Vectors • Length of the vector arrow (magnitude) = shows how fast the ground is moving at the GPS station. • Direction of the vector arrow = the direction that the ground is moving at that GPS station • Tail of vector = location of GPS station 13
About Velocity Vectors Notice the length of the three sets of vectors. Where is the ground moving the quickest? 14
Reference frames: North American & Pacific Plates North American Reference frame Pacific Reference Frame The rest of the world moves; The rest of the world ’ s plates move, The Pacific plate doesn’t move. The interior of the North American plate doesn’t move. 15
Add Features and Velocity Vectors 16
Part 3 continued: Sketch and Study the Vectors • Sketch some of the observed velocity vectors on your map of the Western United States • Answer questions in Part 3: Examine GPS Vector Data con%nued • Discuss with your teammate • Bonus: How would you characterize the width of the plate boundaries on your map? • Based on your data, which plate boundaries should be shown as a thin line or a broad zone? Why? 17
Part 4: Put It All Together 18
Quick Reference: What’s this boundary type? How do the lengths of the vectors change - Longer / shorter as they get closer to land? Which way are they pointing? Reference frame: Pacific Plate 19
Quick Reference How do the lengths of the vectors change - Longer / shorter as they get closer to land? Reference frame: South American Plate 20
Quick Reference: Convergent Boundary Longer vectors running into shorter vectors towards land Draw this in the box under Part 4: Put it all together 21
Quick Reference: What’s this boundary type? How do the lengths of the vectors change - Longer / shorter as they get closer and onto land? Which way are they pointing? Reference frame: North American Plate 22
Quick Reference: How do the lengths of the vectors change - Longer / shorter as they get closer and onto land? Which way are they pointing? Reference frame: Pacific Plate 23
Quick Reference: Transform Boundary Longer vectors parallel to shorter vectors Draw this in the box under Part 4: Put it all together 24
Quick Reference What’s this boundary type? Which way are the vectors pointing? How do the lengths of change? Reference frame: No Net Rotation 25
Quick Reference Which way are the vectors pointing? How do the lengths of change? Reference frame: European Plate 26
Quick Reference: Divergent Boundary Example 2 Example 1 Vectors poinAng away from each other Draw this in the box under Part 4: Put it all together 27
What’s this plate boundary? Reference frame: Pacific Plate 28
Divergent Boundary Reference frame: North American Plate 29
Can you name the boundary types? 30
Part 4: Sketch and Study the Modeled Vectors • Sketch vectors where they are very different from each other • Draw where you believe the plate boundaries are located • Compare with plate boundaries in EarthScope Voyager Jr. • Answer questions • Discuss with your teammate 31
Plate Boundaries Along the West Coast 32
Thinking of Boundaries as Zones 33
Global Motion 34
Wrap Up What we did: • Explored locations of earthquakes and volcanoes • Compared plate motion between the Pacific Northwest and California • Determined plate boundary zones using multiple lines of evidence: Ø Ground motion using GPS vector maps Ø Locations of § Earthquakes § Volcanoes 35
Other Tools to Explore • UNAVCO GPS, Earthquake, Volcano Viewer o http://www.unavco.org/software/visualization/ GPS-Velocity-Viewer/GPS-Velocity-Viewer.html o Google search: unavco GPS Velocity Viewer • IRIS Earthquake Browser o www.iris.edu.ieb 36
Thank You! Contact: education unavco.org http://www.unavco.org/ Follow UNAVCO on _______ Facebook Twitter 37
Recommend
More recommend