
Vish Environment Current Work › Knotted Torus › Colliding Galaxies Future Projects
Software environment for implementing visualization algorithms brought to LSU by Dr. Benger. Vish renders objects and provides an interface to develop them on. Vish objects may specify input slots such as scalar and vector fields and are created through a parameterized database. These Vish objects are implemented in the class VObject. All VObject's may make use of parameters which are requested during construction. Such parameters are specified via a textual description and native C++ type.
class myObject : public VObject { public: myObject(const string&name, const VCreatorBase&VC) : VObject(name, VC) { addParam( “size” , 20); } };
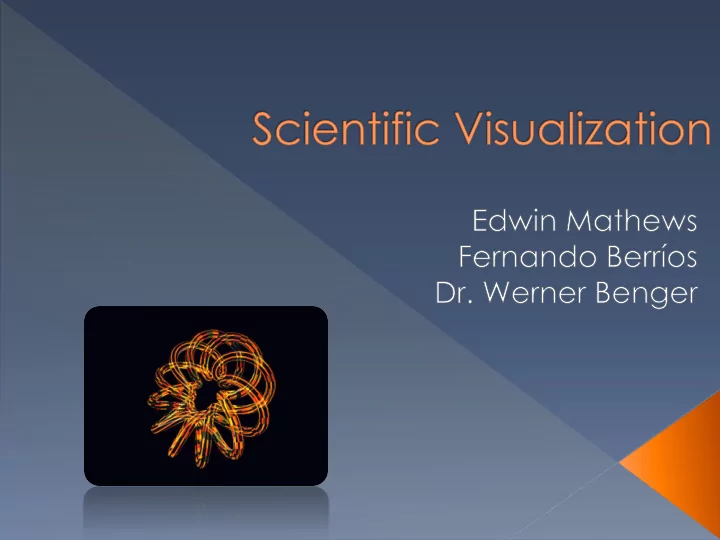
A class of knot that is specified by a pair of coprime integers p and q. Given the task of converting a Windows screensaver display into a Vish Object to create a 3D visualization of a Torus Knot. Two very different code structures but both using the OpenGL API
Astrophysical data set created at the University of Innsbruck in Austria Within the data set are scalar field data of particle internal energy, temperature, potential energy, and others For this visualization we used vector field data of particle velocity
Using Vish, create a series of visualizations are both useful for the scientists interpreting the data and visually stimulating for the casual viewer Make a movie with the colliding galaxies that captures all of its elements effectively
Frame1
Frame 2
Frame 3
Frame 4
Frame 6
Frame 7
Frame 8
Colliding Galaxy Movie Further Working with Torus Knot Gaussian Curvature Module
Next step in visualization Need to determine › Camera movement › Visualization properties › Time scales / Length / Resolution
Implementing changes in the object that can be made directly from the GUI › Radii, number of knots, coloring, etc. Using the Torus to create a 3D visualization of an M.C. Escher artwork
Visualization team is currently working with a CFD model of a stir tank
Create a visualization means that could represent the turbulence of the fluid in the data Gaussian Curvature could be calculated along pathlines of fluid particles and color coded in their visualization to illustrate the variance of curvature
Once developed, could be used for other data sets where the measure of curvature is relevant Would be accessible from the Vish GUI for any set of data
References Stir Tank Streamline data http://sciviz.cct.lsu.edu/projects/vish/album/stirtankstreamlines/index.html http://mathworld.wolfram.com/TorusKnot.html http://sciviz.cct.lsu.edu/projects/vish/ http://www.mcescher.com/Gallery/
Recommend
More recommend