Understanding and Tuning the Performance of Critical Sections with - PowerPoint PPT Presentation
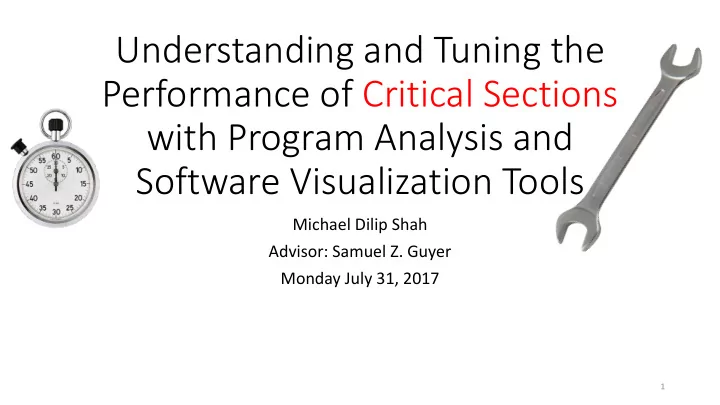
Understanding and Tuning the Performance of Critical Sections with Program Analysis and Software Visualization Tools Michael Dilip Shah Advisor: Samuel Z. Guyer Monday July 31, 2017 1 Why Care About Performance Servers Mobile
Understanding and Tuning the Performance of Critical Sections with Program Analysis and Software Visualization Tools Michael Dilip Shah Advisor: Samuel Z. Guyer Monday July 31, 2017 1
Why Care About Performance • Servers • Mobile • Games Image Sources: www.facebook.com http://www.techcrok.com/ 2 http://modloader-for-minecraft.en.softonic.com/
"The number of transistors incorporated in a chip will approximately Moore’s Law double every 24 months." --Gordon Moore, Intel co-founder 3 http://www-cs-faculty.stanford.edu/~eroberts/cs181/projects/2010-11/TechnologicalSingularity/pageviewa478.html?file=forfeasibility.html
"The number of transistors incorporated in a chip will approximately Moore’s Law double every 24 months." --Gordon Moore, Intel co-founder • Physically (on the atomic scale) transistors are packed very tightly together • Heat becomes a problem • Energy consumption increases 4 http://www-cs-faculty.stanford.edu/~eroberts/cs181/projects/2010-11/TechnologicalSingularity/pageviewa478.html?file=forfeasibility.html
Now we use multiple processors to increase performance Compute Y Compute Z 5
Rendering an Image in Parallel Sunflow – Java Multithreaded Raytracer 6
Setup 16 threads Sunflow – Java Multithreaded Raytracer 7
Divide and Conquer 8
Measure the performance Threads Time per frame 1 20 seconds 16 6 seconds 9
Measure the performance Threads Time per frame 1 20 seconds 16 6 seconds • Why is this not 16 times faster? 10
Amdahl’s Law • We are limited in performance by the number of serial tasks in a program • Ratio of serial tasks to parallel tasks dictates the maximum speedup. Amdahl’s Law Speedup = T Serial runtime T Parallel runtime 11
Resources in a program are shared • Only 1 bunny in this scene 12
Resources in a program are shared • Only 1 bunny in this scene • Attempting to update a shared resource by 2 or more threads at the same time results in a data race 13
Threads put in a waiting queue • A few threads work Blocked • Threads are blocked in Blocked order to . . . enforce correctness Blocked 14
Java Concurrency – Synchr hroni nized Method Example synchronized void modifyBunny() { // . . . // modify geometry for the bunny // . . . } 15
Synchr hroni nized – puts a lock o over s shared resources synchronized void modifyBunny() { // . . . // modify geometry for the bunny // . . . } 16
Criti tical S Secti tions Defined ● A section of code that is executed by only one thread at a given time. Critical Section Blocked Blocked Thread Thread Thread ……………….. 1 2 N 17
Corr rrectness (can b be) Ea Easy Performance Hard public class DrawPicture{ DrawPicture(…) {…} lighting (…) {…} tesselate(…) {…} shadows (…) {…} geometry(…) {…} getPixel (…) {…} getNumLights (…) {…} } 18
Corr rrectness (can b be) Ea Easy Good job— Performance Hard no data races here! public class DrawPicture{ DrawPicture(…) {…} lighting (…) {…} synchronized tesselate(…) {…} synchronized shadows (…) {…} synchronized geometry(…) {…} synchronized getPixel (…) {…} synchronized getNumLights (…) {…} synchronized } 19
Correctness (can be) Easy Your program runs Performance Hard rd sequentially– did you forget about Amdahl’s law? 20 http://www-cs-faculty.stanford.edu/~eroberts/cs181/projects/2010-11/TechnologicalSingularity/pageviewa478.html?file=forfeasibility.html
The Big Picture With Multithreaded Code • We want our software to run fast • Writing multithreaded code correctly is difficult • We use synchronized code when a common resource is shared amongst threads. 21
The Problem Real world programmers do not always understand the performance of their code in critical sections . 22
Related Work • 2012, PLDI - Understanding and Detecting Real-World Performance Bugs • 332 previously unknown performance problems are found in the latest versions of MySQL, Apache, and Mozilla applications • “Developers frequently use inefficient code sequences that could be fixed by simple patches. These inefficient code sequences can cause significant performance degradation and resource waste, referred to as performance bugs. Meager increases in single threaded performance in the multi-core era and increasing emphasis on energy efficiency call for more effort in tackling performance bugs. “ 23
Related Work • 2012, PLDI - Understanding and Detecting Real-World Performance Bugs • 332 previously unknown performance problems are found in the latest versions of MySQL, Apache, and Mozilla applications • “Developers frequently use inefficient code sequences that could be fixed by simple patches . These inefficient code sequences can cause significant performance degradation and resource waste , referred to as performance bugs. Meager increases in single threaded performance in the multi-core era and increasing emphasis on energy efficiency call for more effort in tackling performance bugs. “ 24
Related Work • 2012, PLDI - Understanding and Detecting Real-World Performance Bugs • 332 previously unknown performance problems are found in the latest versions of MySQL, Apache, and Mozilla applications • “Developers frequently use inefficient code sequences that could be fixed by simple patches . These inefficient code sequences can cause significant performance degradation and resource waste , referred to as performance bugs. Meager increases in single threaded performance in the multi-core era and increasing emphasis on energy efficiency call for more effort in tackling performance bugs. “ 25
Related Work • 2013, ICSE - Toddler: Detecting Performance Problems via Similar Memory-Access Patterns • “detecting performance bugs usually requires time-consuming, manual analysis of execution profiles. The human effort for performance analysis limits the number of performance tests analyzed and enables performance bugs to easily escape to production. “ 26
Related Work • 2013, ICSE - Toddler: Detecting Performance Problems via Similar Memory-Access Patterns • “ detecting performance bugs usually requires time-consuming, manual analysis of execution profiles . The human effort for performance analysis limits the number of performance tests analyzed and enables performance bugs to easily escape to production . “ 27
Thesis Statement Static, dynamic, and software visualization analysis tools focused on critical sections are needed to uncover performance variability in critical sections to avoid unintended software hangs 28
Thesis Statement Static, dynamic, and software visualization analysis tools focused on critical sections are needed to uncover performance variability in critical sections to avoid unintended software hangs A potential bottleneck – remember only 1 thread of execution 29
Thesis Statement Static, dynamic, and software visualization analysis tools focused on critical sections are needed to uncover performance variability in critical sections to avoid unintended software hangs If we cannot estimate time accurately – does that impact user experience? 30
Thesis Statement Static, dynamic, and software visualization analysis tools focused on critical sections are needed to uncover performance variability in critical sections to avoid unintended software hangs New tools and analysis will provide insights into how to solve this problem. 31
Program Analysis • Static Analysis • Dynamic Analysis 32
Iceberg 2.0 Dynamic Analysis Dynamic Analysis is information gathered when the program runs. 33
Bytecode Instrumentation with Javassist Compile with Java Write Build Execute Program compiler Transformation Javaagent with Javaagent 34
Compile with Java compiler 35
Compile with Java Write compiler Transformation • Leverage our previous static analysis to feed our dynamic analysis which methods to instrument 36
Compile with Java Write compiler Transformation • Use the Javassist bytecode engineering library to transform actual Java bytecode . • Code that will be injected into critical sections • Care taken to minimally perturb the system Method Entry Probe Method Exit Probe 37
Compile with Java Write Build compiler Transformation Javaagent • Build transformation into a .jar file. 38
Compile with Java Write Build Execute Program compiler Transformation Javaagent with Javaagent 39
Compile with Java Write Build Execute Program compiler Transformation Javaagent with Javaagent • Record time spent within critical sections 40
Compile with Java Write Build Execute Program compiler Transformation Javaagent with Javaagent • Record time spent within critical sections • Gathering entry and exits from methods 41
Compile with Java Write Build Execute Program compiler Transformation Javaagent with Javaagent • Record time spent within critical sections • Gathering entry and exits from methods • Variety of power in instrumentation • Can record stack • Can record thread contention • Can record full call tree 42
Recommend
More recommend
Explore More Topics
Stay informed with curated content and fresh updates.

